Responsible AI Playbook for Agentic AI

From input guardrails, trajectory evaluation to session outcomes: playbook for regulated teams buil...
Traditional ML and RAG evaluation gave teams a familiar set of measures: accuracy and drift for models, then retrieval precision and recall, ROUGE, BLEU, faithfulness, and coherence for generated responses. Agentic systems require a broader measurement model.
Agents introduce new failure surfaces. They can choose the wrong tool, pass dangerous arguments, loop through failed calls, or lose context during a handoff. Some failures can sit behind an acceptable final response. Others produce a bad response whose cause becomes clear only when you inspect the trajectory. Evaluating agents therefore requires monitoring both execution and outcomes.
In our work with responsible AI, risk, and platform teams at large global enterprises across banking, insurance, and other regulated sectors, the recurring challenge is deciding what to measure and where each check belongs. This guide maps metrics for task resolution, tool use, handoffs, guardrails, and system reliability across CI, asynchronous production monitoring, and the synchronous request path.
Agents fail in the middle, not just at the end
A banking agent may select the wrong tool or pass arguments outside its authority. An insurance claims agent may retrieve the correct policy but make an unsupported coverage determination. An internal agent may complete the task only after looping through failed calls and consuming unnecessary time and tokens.
These failures require measurement at several levels. Response-level metrics assess individual calls. Trajectory metrics cover tool selection, argument validity, loops, and recovery. Inter-agent and conversational metrics cover handoffs, context preservation, task completion, and goal resolution. Guardrail and system metrics cover policy violations, unsafe actions, latency, cost, and reliability.
Coverage should match the workflow. A banking advisory agent and an internal research agent do not need the same controls. SR 26-2 explicitly excludes generative and agentic AI, but its risk-based principle is still useful: validation and monitoring should scale with purpose, exposure, materiality, and the cost of failure.
The registry below is a broad reference, not a checklist. Review traces, identify the failure modes relevant to the workflow, and enable the checks that cover them.
Metrics across the agent lifecycle
A conversation is a series of messages between participants (customer, staff, or AI agent) aimed at resolving an intent. It can contain one or more threads, each tied to an intent and an agent. Messages can run through guardrails whose actions range from masking PII to handing the conversation to a human.
Risk shows up before the model sees input, after each call, before the user sees output, across the full trajectory, at handoffs, and at session close. System reliability and cost sit under all of it. Evaluation levels describe how far you zoom (one call → one agent → multi-agent → session). Stages describe when the check runs in that lifecycle.
Evaluation levels
Evaluator types
For LLM-as-Judge metrics, prefer binary pass/fail criteria tied to a real failure mode over vague 1-5 scores. Before a judge becomes a CI or production gate, calibrate it against a domain expert: measure true positive and true negative rates on labeled examples, and correct for bias. An uncalibrated judge looks precise and still drifts.
Guardrails also tag an implementation approach: Non-LLM (regex, keywords, patterns, classic ML models), LLM, or Cascading (fast heuristic first, LLM only when ambiguous). If a metric says LLM-as-Judge under an input or output stage, treat it as async or review-path scoring unless it's on the critical path.
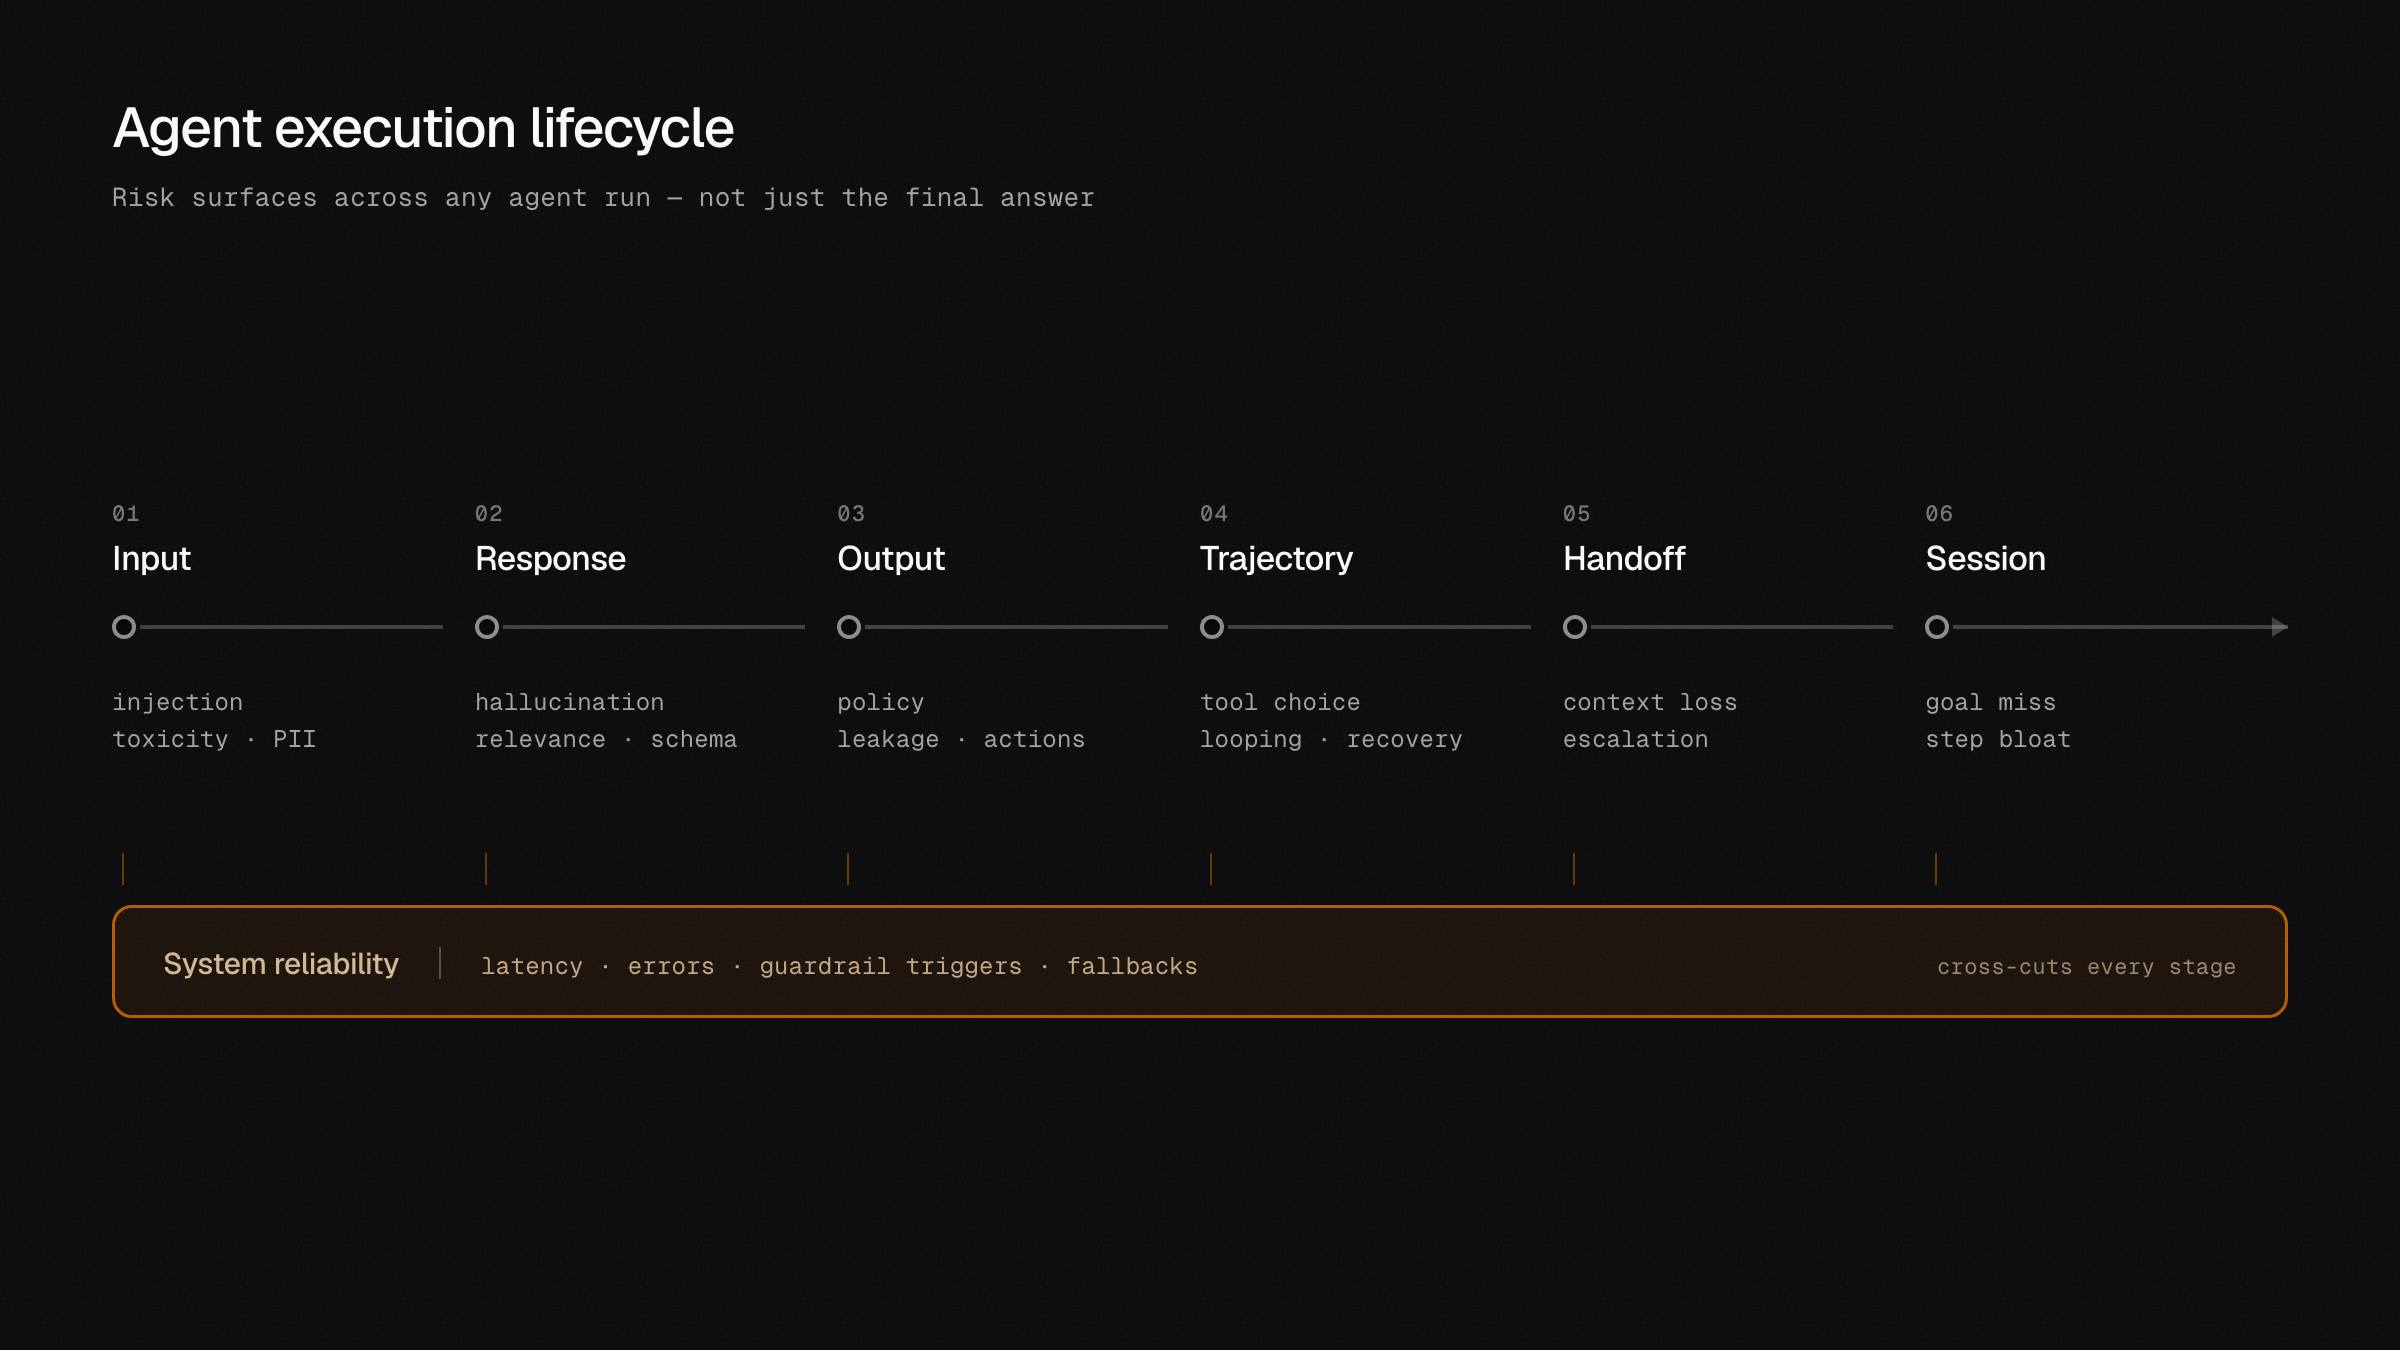
Some risks appear at multiple stages. Toxicity, privacy, and profanity, for example, need separate checks at the input and output hook points.
Stage 1: Input guardrails
Hook: before the inbound message is forwarded to the agent.
Input guardrails execute on every inbound user message before it reaches the agent. They evaluate in priority order. If a guardrail triggers, the configured action fires (for example eject to a human, send a canned response, or mask content) and downstream processing may halt. High-consequence risks here usually belong on the synchronous path. We list metrics separately so you can map coverage and actions; in production, overlapping LLM checks such as Harmful Content, Off Topic, and Toxicity can share one structured model call when labels and actions stay distinct.
Guardrail checks
Input safety metrics
Stage 2: Response-level evaluation
Hook: server-side evaluator on the model event, runs after each individual LLM call.
Response-level metrics evaluate a single LLM call in isolation. They compare the generated output against ground truth, assess output quality, and verify structural correctness. These metrics run as server-side evaluators attached to the model event within the trace, so they can use that call's inputs, retrieved context, and references, not only the generated text.
Quality metrics
Textual similarity metrics
Structural reliability metrics
Stage 3: Output guardrails
Hook: after the agent produces a response, before delivery to the customer.
Output guardrails inspect the generated response before the user sees it. They enforce compliance, prevent hallucinated advice, and ensure grounded, safe responses. Actions below are example policy responses; adapt them to your product and jurisdiction.
Guardrail checks
Output safety metrics
Groundedness here is the blocking twin of Answer Faithfulness in Stage 2: score the call asynchronously if you want; put a groundedness guard on the delivery path when an ungrounded answer is costly.
In banking, an output can be grounded and well-written while still crossing a jurisdiction- or product-specific advice boundary. Map AU examples (complaint handling, financial advice) to the laws, policies, products, and customer contexts that apply to your workflows.
Stage 4: Single-agent trajectory
Hook: after the full agent execution completes (chain / agent-run event).
Trajectory evaluation examines the observable action sequence of a single agent from intent receipt to final response: tool selection, intermediate steps, and loops. Some models or runtimes expose a reasoning trace, but current frontier APIs often return only a summary or keep the reasoning state opaque. Reasoning Trace Consistency applies only when the trace itself is exposed. Evaluating the observable trajectory still requires span-level visibility, not a score on the final message alone.
Stage 5: Inter-agent evaluation
Hook: after agents in a thread complete, or on handoff events.
Inter-agent evaluation assesses communication, handoff quality, and coordination between multiple agents in one conversation thread. Relevant when conversations span multiple intents or an orchestrator delegates to specialists.
Stage 6: Conversational-level evaluation
Hook: at conversation close, or on a scheduled batch pass over the session.
Conversational-level evaluation assesses the end-to-end experience across all threads and turns. These metrics capture holistic quality that you cannot see at a single response or single-agent level.
System performance and reliability
Hook: OpenTelemetry auto-instrumentation on LLM and tool-call spans, captured continuously.
System performance metrics are captured automatically via OpenTelemetry. They feed real-time monitoring dashboards and CI/CD quality gates.
Performance metrics
Reliability metrics
Sustainability metrics
Hook: batch computation aggregated on a schedule from OTEL spans and infrastructure telemetry.
Sustainability metrics estimate the environmental impact of AI inference workloads. They are extrapolated from system performance data and infrastructure metadata.
Guardrail configuration properties
Each guardrail needs a few properties in configuration:
Recommended guardrail priority order
The following order is a starting point for guardrail evaluation. Lower priority numbers execute first.
Priority alone is not enough. How a check is implemented, and whether it sits on the synchronous path, decides whether that order is usable in production.
Production, CI, drift, and human review
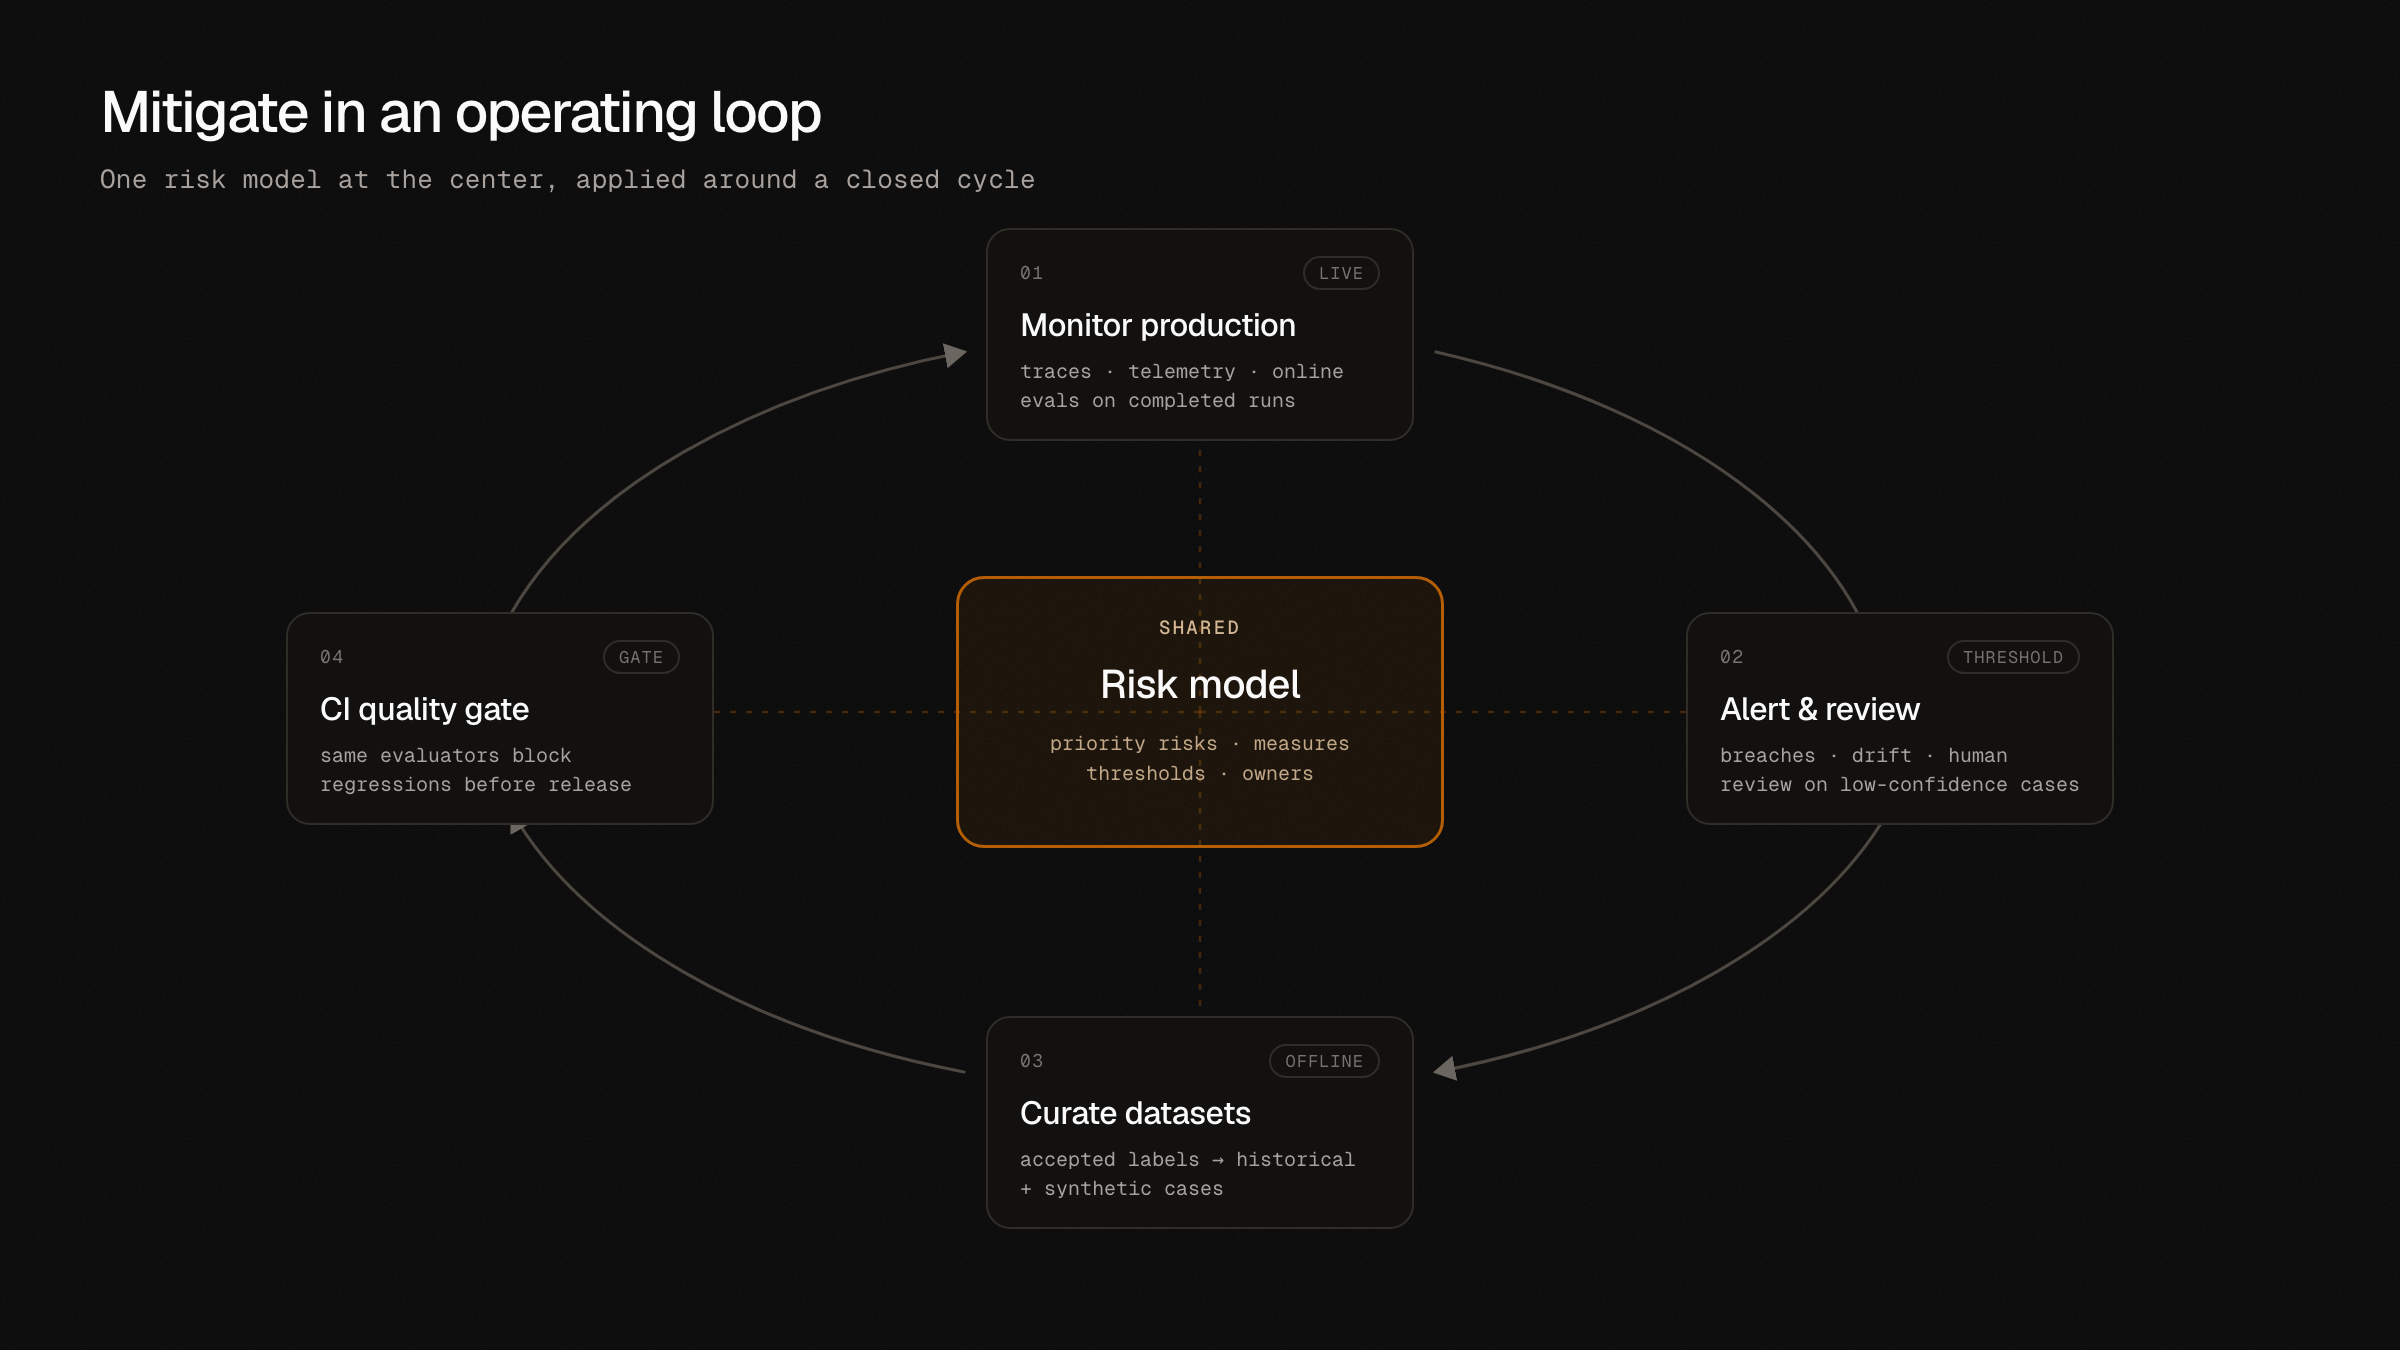
Real-time monitoring. System performance metrics (latency, TTFT, error rates) and guardrail trigger rates stream to dashboards via OpenTelemetry. Alerts fire when metrics breach defined thresholds (for example P95 latency exceeding 5 seconds, or jailbreak trigger rate exceeding 2%). Set the actual numbers from your workflow baseline and risk tolerance.
CI/CD quality gates. Before any agent, prompt, or model change is promoted to production, the evaluation pipeline runs response-level and agent-level metrics against a curated dataset of historical user journeys and synthetic test cases. Changes are blocked if any calibrated metric regresses beyond the defined tolerance.
Batch evaluation and drift detection. On a scheduled cadence (for example weekly), evaluate the full metric registry you care about against a representative sample of production conversations. Compare results to baseline benchmarks to detect quality drift, emerging safety risks, or shifts in customer intent distribution.
Annotation queues. Conversations flagged by guardrails, low-confidence evaluators, or random sampling are routed to human annotation queues. Annotators provide ground-truth labels that feed back into the evaluation dataset, closing the feedback loop for metric calibration and model improvement. Prefer binary pass/fail with short critiques before a judge becomes a CI or production gate.
Operationalizing with HoneyHive
HoneyHive is one way to wire those modes together. Use CI regression checks to catch metric degradation before release. After deployment, online evaluations score matching traces asynchronously, and alerts surface threshold breaches. Trajectory View helps you debug trajectory failures in long-running agents. Send ambiguous cases to annotation queues to calibrate judges and grow the evaluation dataset.
The HoneyHive skills and CLI support coding-agent workflows in Cursor, Claude Code, and similar tools. They can instrument the application, create evaluators, update datasets, debug alerts, and configure online scoring as part of the improvement loop.
Blocking, masking, and escalation still live in your orchestration layer. HoneyHive helps you trace, monitor, and improve your agents.
How to start
- Pick one high-risk workflow and document its lifecycle steps and map risks, available actions, and potential failures.
- Review a sample of real traces and list the observed failure modes. If traces are not yet available, use simulation to create synthetic traces.
- Map each priority risk to a lifecycle stage and metrics.
- Calibrate the first judges and guardrail thresholds against those traces. Include latency, cost, and error metrics for the controls themselves.
- Expand coverage after the first set agrees with human review on held-out data.
For runnable evaluators and monitoring patterns, see evaluator templates. To work through your agent's risk surface and connect controls to production alerts and CI gates faster, book a 30-minute session with our team.