HoneyHive for Coding Agents

Bringing the same observability and evals discipline we built for AI applications to your coding agents.
Today, we're launching HoneyHive for Coding Agents: production-grade observability for Claude Code and Devin, with full session traces, usage and spend analysis, custom ROI funnels, and the same evals layer we already ship for the rest of your AI stack.
A local daemon captures every user prompt, agent response, and tool call via hooks, and ingests the data into HoneyHive's tracing and evals platform. From there, finance, engineering, risk, and security teams can finally answer the questions they've been asking about coding-agent rollouts: questions that, until now, no one in the org has been able to answer.
Why we built it
The tokenomics conversation is now a top AI workstream inside most enterprises we work with. At GTC this spring, Jensen Huang summarized the shift: "Every engineer is going to have a token budget." The unit of engineering work has changed, and the cost basis has changed with it. The instrumentation hasn't.
Most teams running coding agents at scale today operate with two data points: a monthly invoice from coding agent platforms and anecdotal velocity feedback from engineers. Everything between those points is dark. There's no view into which teams are spending budget on net-new features versus recurring bug classes, how much code had to be reverted before a working solution shipped, which workflows justify their token cost, or which agents are executing unaudited shell commands against production repositories.
This is the same instrumentation gap LLM application teams faced before tracing became table stakes. Coding agents are now the most autonomous systems most enterprises have running against production code, and they warrant the same observability discipline applied to any other critical service. HoneyHive for Coding Agents closes the gap.
What you get
Full session visibility. Every agent session is captured as a structured trace tree: user turns, agent turns, and tool calls with arguments, results, and durations (for Claude Code, native tools like Bash, Edit, Read, and Grep). In the Traces UI, each session opens a side panel with five views: Tree (span hierarchy and event details), Timeline (duration and bottlenecks), Graph (execution flow), Trajectory (behavior across steps), and Thread (chat-style dialogue). Exporters also attach a conversation summary and a full session transcript on the session so you can review what was said and debug how the agent got there.
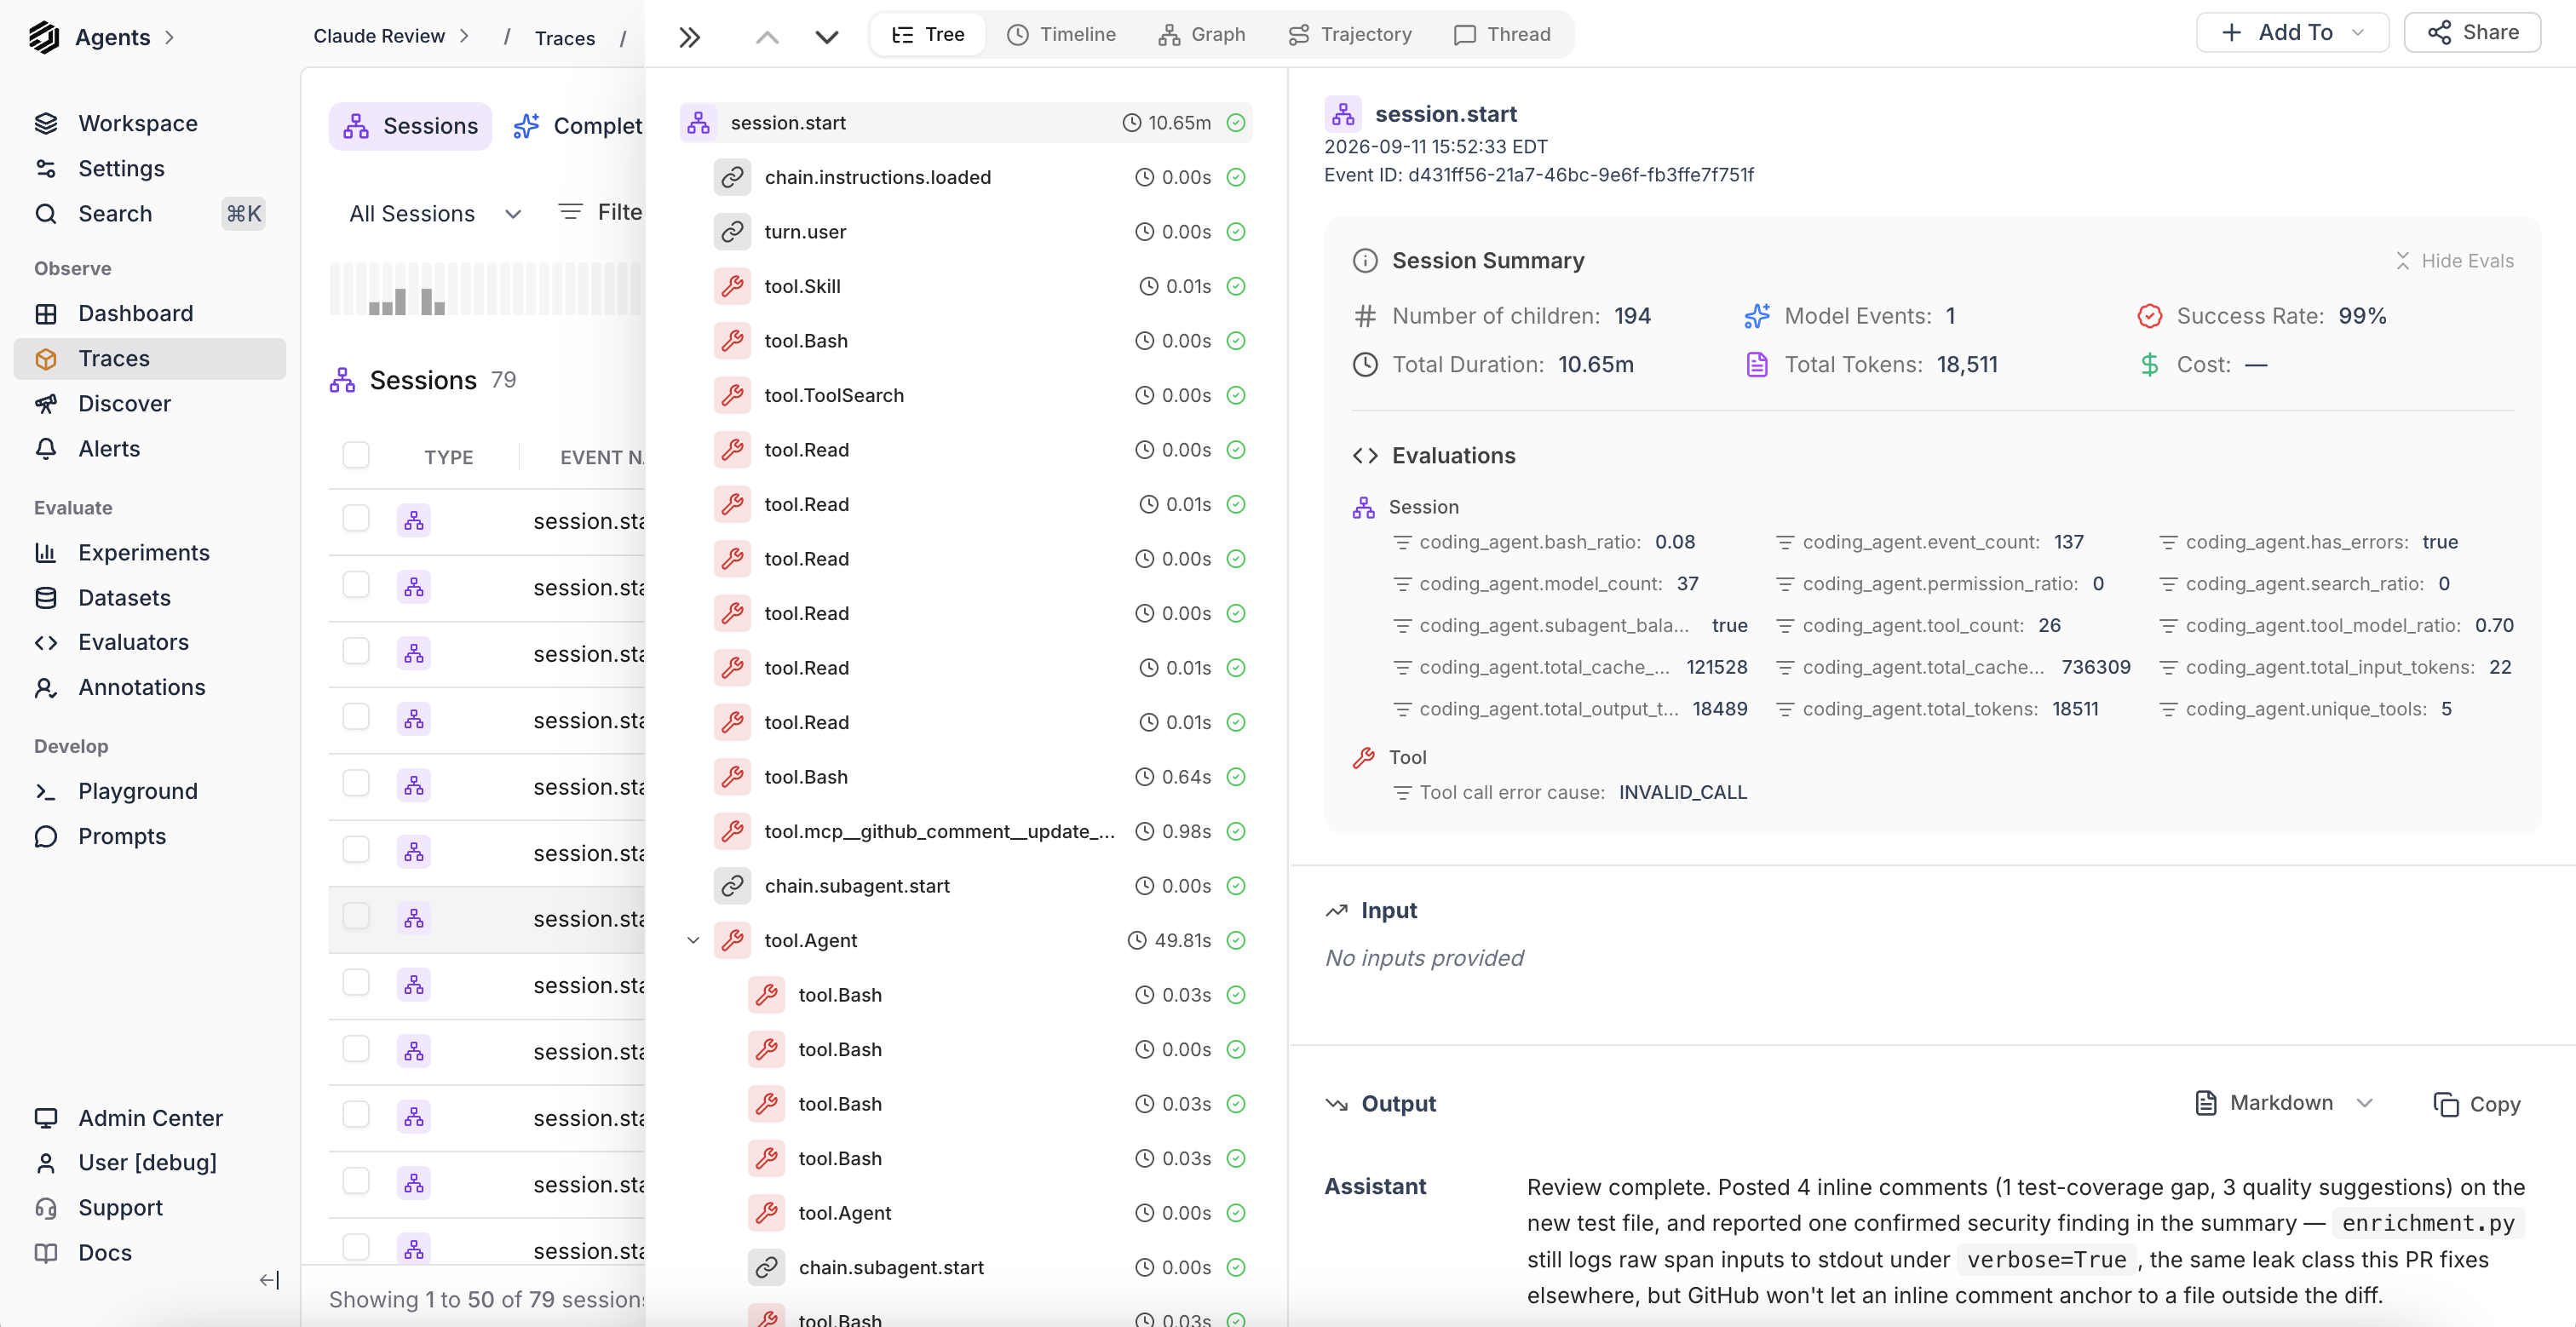
Usage and spend analysis. Sessions are tagged by repository; token usage appears on individual events and session metrics when the transcript includes it. Combine trace data with pricing, Git, CI, or internal feedback signals to build spend and ROI views by team or work type, replacing the invoice-only view with a breakdown of what work the budget produced.
Custom ROI analysis. Every team defines coding-agent value differently. Some prioritize PR merge rate, some prioritize code surviving in main after thirty days, some prioritize reviewer time saved. Rather than ship one fixed funnel, we built funnel definition on top of HoneyHive's user feedback API, which accepts arbitrary JSON on every session. Wire in the signals that matter to your org (Git events, CI/CD outcomes, reviewer verdicts, engineer ratings, implicit accept/discard signals, cost categories) and chart them alongside token usage, latency, and tool-use data.
Once attached, these signals are filterable and groupable across the dashboard. You can answer questions like "merge rate on Claude Code sessions this quarter, by team" or "spend per merged PR, backend org versus frontend org" directly, without a multi-quarter data engineering build.
Risk and security visibility. The same trace data gives risk, security, and enterprise architecture teams visibility into agent behavior: which tools each agent is invoking, with what arguments, against which repositories; where agents are executing shell commands, calling external endpoints, or modifying files outside the working directory; which sessions warrant review under your security policies. The trace becomes the input layer for the verifiers and policies your security team builds on top of this data.
Evals. The online and offline eval pipelines you already run on your LLM applications now extend to coding-agent sessions. Score for correctness, code quality, safety, policy adherence, or any custom dimension your team cares about.
How to install it
For Claude Code, integration is a single daemon that runs locally and captures sessions via Claude Code's hooks system. No SDK calls, no decorators, no application code changes:
The daemon installs hooks, merges pre- and post-tool events into single events with accurate durations, accumulates chat history per session, and ships everything to HoneyHive with local buffering if the network drops. Stop it with honeyhive-daemon stop.
For Devin, use the exporter in the honeyhive-daemon repo. It polls Devin's API and batch-syncs sessions:
Dashboards and evals work across both platforms.
Full setup guides are here:
Get Started
HoneyHive for Coding Agents is available today.
- Install the daemon, and you'll have your first traces within a single session.
- More coding agent integrations are coming soon! Contact us for early access.
- Book a call if you'd like help designing the right usage categories, ROI funnel, or risk dashboards for your organization.