Building the Platform Layer for Enterprise Agents

How to standardize telemetry, evaluation, and governance across custom, managed, and low-code agent stacks.
A regulated enterprise running agents in production rarely runs one agent stack. The cards team builds a custom orchestrator on LangGraph. Customer service pilots Microsoft Copilot Studio. Each choice is locally rational, made by teams with different budgets, different regulators, and different engineering depth.
The trouble starts when those agents hand work to each other. A disputed charge enters through a chat agent, routes to a disputes agent, and ends with a cards agent issuing temporary credit. One customer interaction now spans three stacks, each with its own telemetry dialect. Unless those stacks share identifiers and comparable telemetry, no one can reconstruct that interaction end to end, judge whether it was handled well, or answer an auditor’s question about it.
The instinct is to standardize the stacks. That targets the wrong layer. Standardize the control layer instead: how agents identify themselves, how their work is correlated, how their telemetry is interpreted, how quality is judged, and what the audit record holds. Let implementation vary underneath those contracts.
Heterogeneous agent stacks are the default
Multi-agent systems in large enterprises tend to converge on a three-tier shape:
- Tier 1, conversation manager. Intent classification, session management, and routing to business-unit agents. Usually owned by a platform or customer-experience team.
- Tier 2, principal agents. Orchestrators for cards, lending, disputes, or account services. Each lives inside its business unit’s budget, KPIs, and regulatory boundary.
- Tier 3, specialized agents. Narrow capabilities such as transaction lookup, fraud scoring, document retrieval, and policy checks. These sit closest to systems of record, where accuracy and reliability matter most.
Because the tiers are owned by different teams, the stacks diverge by design. A principal agent handling long-running workflows needs state management and error recovery that a managed builder does not offer. A routing agent needs neither, and a low-code studio ships it in a fraction of the time. Neither team is wrong.
The cost of that divergence shows up at the handoffs between teams:
- Version skew. When the disputes team updates its handoff protocol, the cards team has to coordinate a matching change. Without clear versioning and backward compatibility, deployments become sequentially dependent across teams.
- Attribution. When session quality degrades, finding the cause means tracing across organizational boundaries: was it the conversation manager’s routing, a principal agent’s orchestration, or a specialized agent’s tool execution? Without shared visibility, teams spend cycles on cross-functional debugging rather than improvement.
- Security at the seams. A disputes agent handles more sensitive PII than a general-inquiry agent. The platform has to support those distinctions without forcing every team into a lowest-common-denominator security model.
Enterprises usually reach for one of two responses, and both fail. The first is a framework mandate, which fails for a structural reason: it binds at the layer where requirements genuinely differ. The second is to let everything vary, including telemetry and evaluation tooling. Across the enterprises we work with, that choice produces the same pattern: five observability tools, seven approaches to evaluation, and no consolidated view of system behavior. The costs compound:
- Audit becomes slow. Risk and compliance teams cannot answer “what did our agents tell customers about X” without review across several systems.
- Debugging tax. Engineers spend time correlating data across tools rather than solving the problem.
- Cost opacity. No consolidated view of spend across agents, models, and teams.
- License proliferation. Overlapping tool contracts with redundant capabilities.
Manual governance cannot close this gap either. Committee review before production works when deployment frequency is low; it breaks when a principal agent orchestrates several specialized agents and teams iterate on prompts and tool logic weekly. Review becomes a bottleneck that slows delivery without proportionally reducing risk, and organizations respond by oscillating between tightening controls after an incident and loosening them under competitive pressure.
Gartner predicts that by 2027, 40% of enterprises will demote or decommission autonomous AI agents due to governance gaps identified only after production incidents occur. The governance gap in these cases is rarely a missing policy document; more often, no one can see, compare, and judge what heterogeneous agents are doing in production. What the platform needs is invariant across every stack: each agent must be registered and owned, each interaction must be correlatable, and each stack’s telemetry must be comparable to the others.
Standardize contracts, not implementations
An enterprise AI control plane is not one product. It is a small set of shared systems that make a mixed agent fleet governable: an LLM gateway, agent identity and registration, a tool catalog, evaluation standards, and shared observability. A useful test for whether something belongs in it:
Applied to the components in turn:
LLM gateway
The gateway is the policy layer for model access: which teams can call which models, at what rate, with which safety filters, and how cost is metered and attributed. Provider differences stay behind one interface, so teams can change models without renegotiating access patterns.
Keep it thin. Business logic belongs in agents, not the gateway. And centralize the policy, not the runtime: gateway instances can be regional and highly available, since a single global endpoint adds latency and blast radius without adding governance.
Agent identity and registry
The registry answers what exists, who owns it, which version is approved, and what it depends on:
- Ownership metadata: name, description, owning team, business unit
- Version history with rollback
- Capabilities and interfaces
- Dependencies on other agents and tools
- Evaluation results and approval status
A registry does not prevent two teams from building similar agents. It makes the overlap visible, so reuse becomes an explicit decision rather than an accident of discovery, and it gives you impact analysis when a shared agent changes. Agent logic, prompts, and orchestration code stay with the product team.
Tool and connector catalog
Connectors to shared systems (CRM, core banking, document stores) are inherently reusable, so package them once, review the code once, and make them discoverable. Two qualifications keep this honest:
- Pin versions and stage upgrades. Updating a shared connector should not silently change behavior for every dependent agent. Teams upgrade deliberately.
- Package review is not dataset approval. A central security review of connector code does not replace the owning team’s review of credentials, permissions, and the datasets that connector can reach.
Evaluation standards
Evaluation templates, risk-tier definitions, and threshold policies live centrally so that “production-ready for a PII-handling agent” means the same thing in every business unit. Domain teams then extend the baseline with evaluators only they can write: banking compliance checks, claims-handling accuracy, policy-specific rubrics. The result is a shared quality baseline with domain judgment layered on top.
Telemetry and observability
The telemetry contract: a stable session identifier on every interaction, structured trace hierarchy, and semantics normalized enough that dashboards, evaluators, and audits work across stacks. It earns the most attention because every other control-plane function consumes it. Registries describe what should exist; telemetry shows what actually happened. Evaluation, cost attribution, incident response, and audit all sit downstream of it.
What stays with teams is everything the test excludes: framework choice, model selection behind the gateway, knowledge indexes and vector databases (document schemas, retention, and update cadence differ too much by domain to centralize), and the business logic that makes an agent worth running. For knowledge in particular, the platform standardizes how retrieval shows up in traces and how retrieval quality is evaluated, and leaves the indexes themselves with the business unit.
Ownership follows the same split:
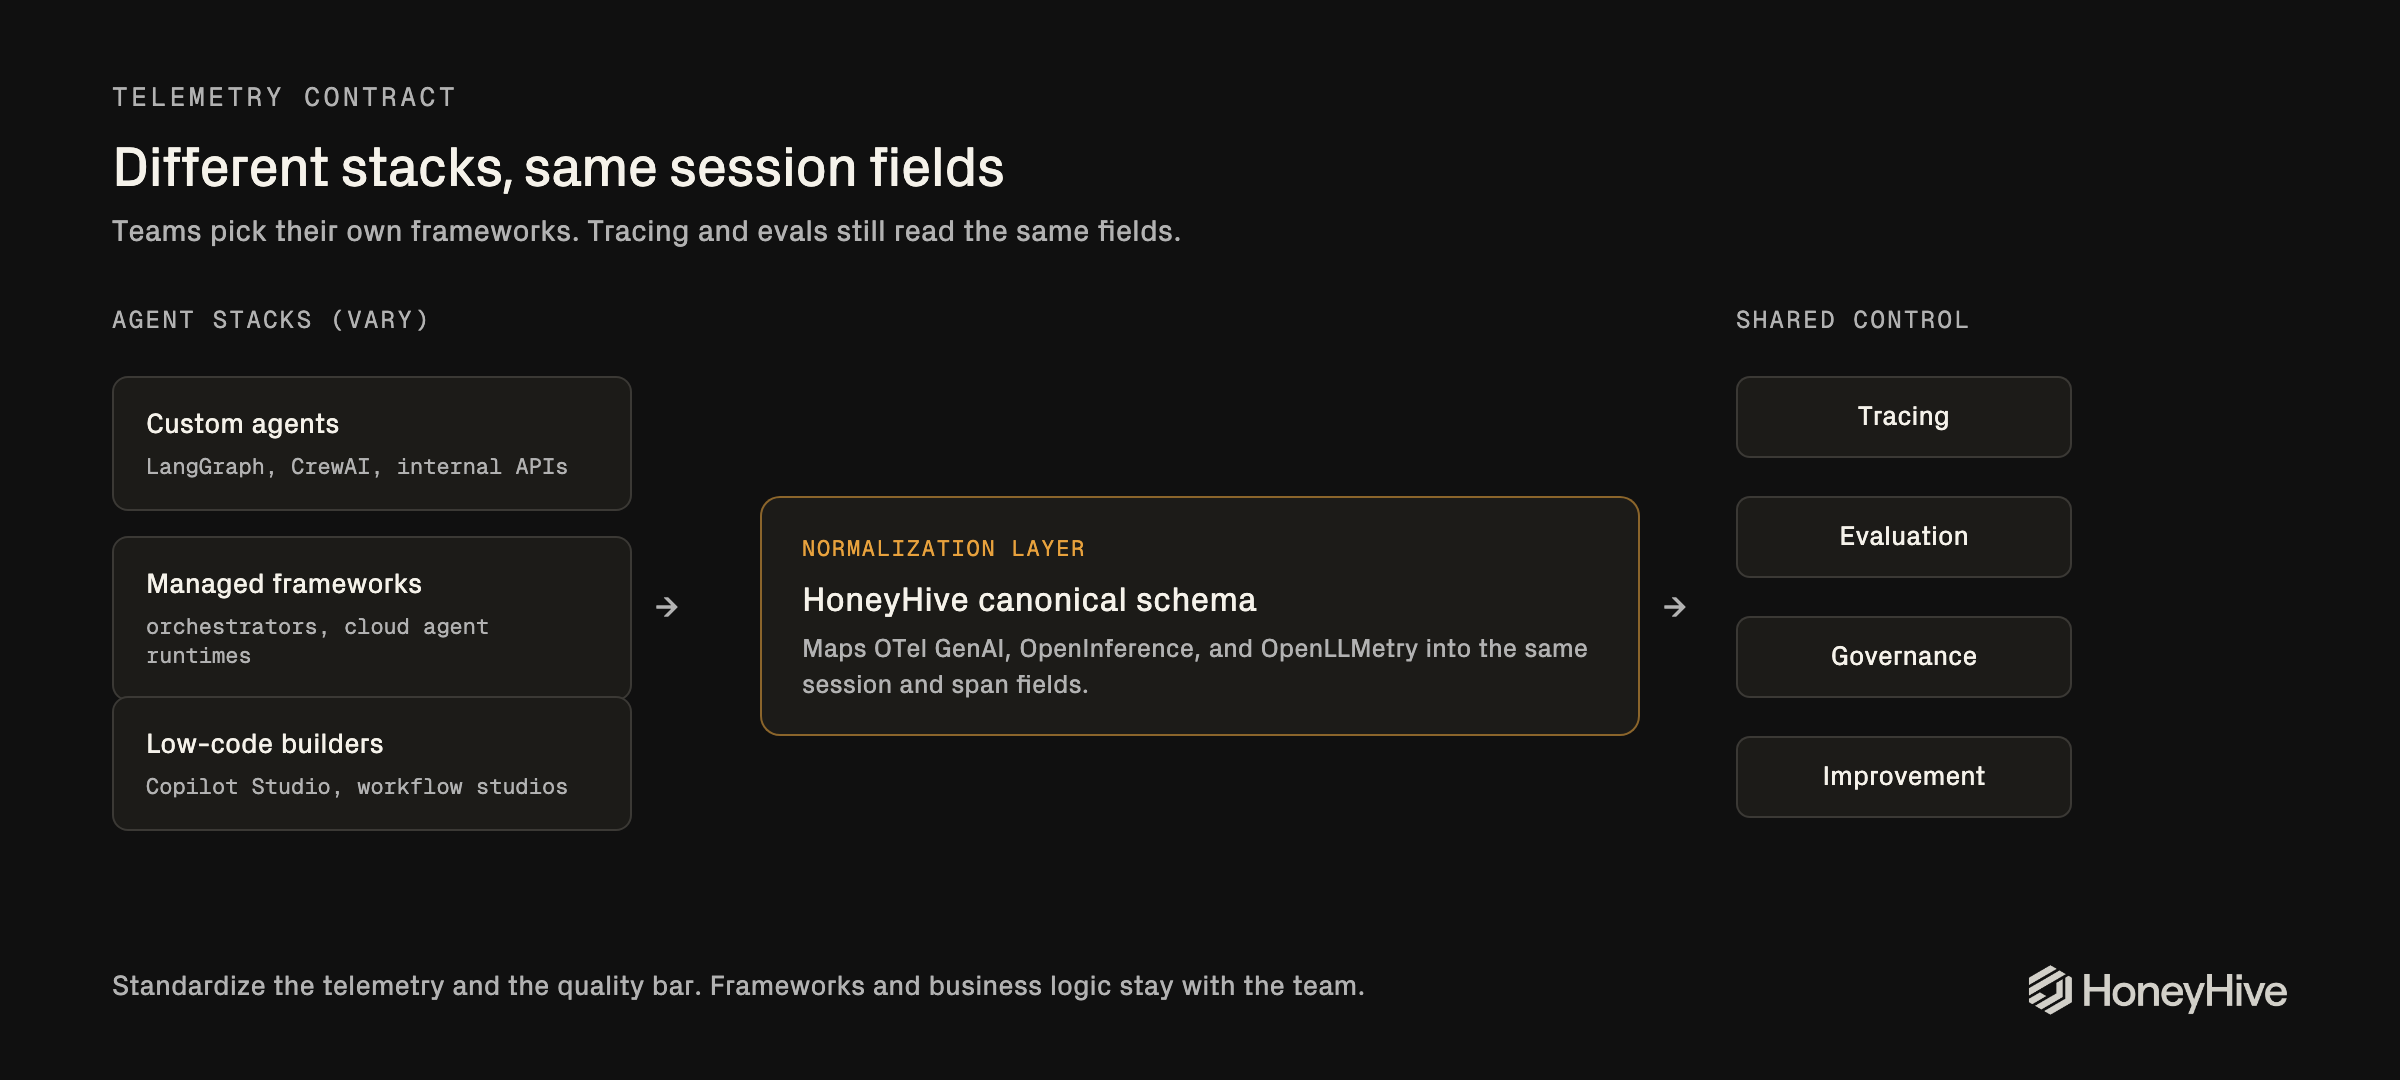
Correlation first: session IDs, then distributed traces
Agent systems put four demands on observability that traditional monitoring, built for availability, latency, and error rates, does not meet:
- Hierarchical attribution. When a session fails or quality drops, the issue has to be attributable to a layer: conversation-manager routing, principal-agent orchestration, specialized-agent execution, or a tool call.
- Semantic quality. An HTTP 200 from a model API says nothing about whether the content was hallucinated, off-topic, or policy-violating. Success has to be evaluated as well as measured.
- Multi-turn context. Interactions pause and resume across turns, sometimes across hours or days. The record has to hold a whole conversation together rather than a single request.
- Organizational boundaries. Different teams own different agents with different data sensitivities. Access control has to follow the org structure while platform teams keep end-to-end visibility.
All four depend on a correlation contract, which few platform teams define explicitly.
Start with the session: the root record for one end-to-end interaction, whether that is a single request or a multi-turn conversation. Child events link to their parent through parent_id, which is how the tree of orchestration steps, tool calls, and model invocations gets built.
The session ID is the minimum enforceable standard
The lowest-friction contract a platform can enforce is that every component participating in an interaction emits the same session_id. That single rule buys a lot:
- All events from one interaction group into a single session view, regardless of which stack emitted them.
- Session-level cost, quality, and audit queries work immediately, before any deeper instrumentation exists.
- It is enforceable at points the platform already controls: gateways, ingress, or a managed builder’s export hooks.
A session ID can be required of every team on day one. It is the standard that keeps end-to-end auditing tractable while the fleet’s instrumentation matures.
The limit: when services share only a session ID, their events land as siblings in the session rather than as parent and child. Siblings are enough for total cost, session-level evaluation, and coarse attribution. They are not enough to tell which upstream call triggered a downstream failure.
Distributed tracing adds the causal graph
For that, add W3C trace context propagation: callers pass trace and session identifiers in outbound headers, and the receiving service attaches its spans as children of the calling span. Remote calls then nest under their caller, and the trace shows who called whom across service and team boundaries. It also survives asynchronous handoffs, where downstream work completes long after the calling span finished. HoneyHive supports both modes, so session ID passing is the floor.
Require a stable session ID everywhere. Add distributed trace context wherever the runtime and team maturity support it.
A worked example: the disputed charge
Here is where the two levels diverge in practice. Let’s look at the dispute we mentioned at the beginning, now as a trace. A customer reports a disputed charge:
- Customer initiates contact through web chat or voice
- The conversation manager classifies intent as “dispute” and routes to the disputes principal agent
- The disputes agent invokes transaction lookup to retrieve charge details
- It invokes merchant verification to validate transaction authenticity
- It invokes policy compliance to assess dispute eligibility
- It synthesizes results and presents resolution options
- The customer requests temporary credit, so it hands off to the cards principal agent
- The cards agent invokes credit issuance and confirms with the customer
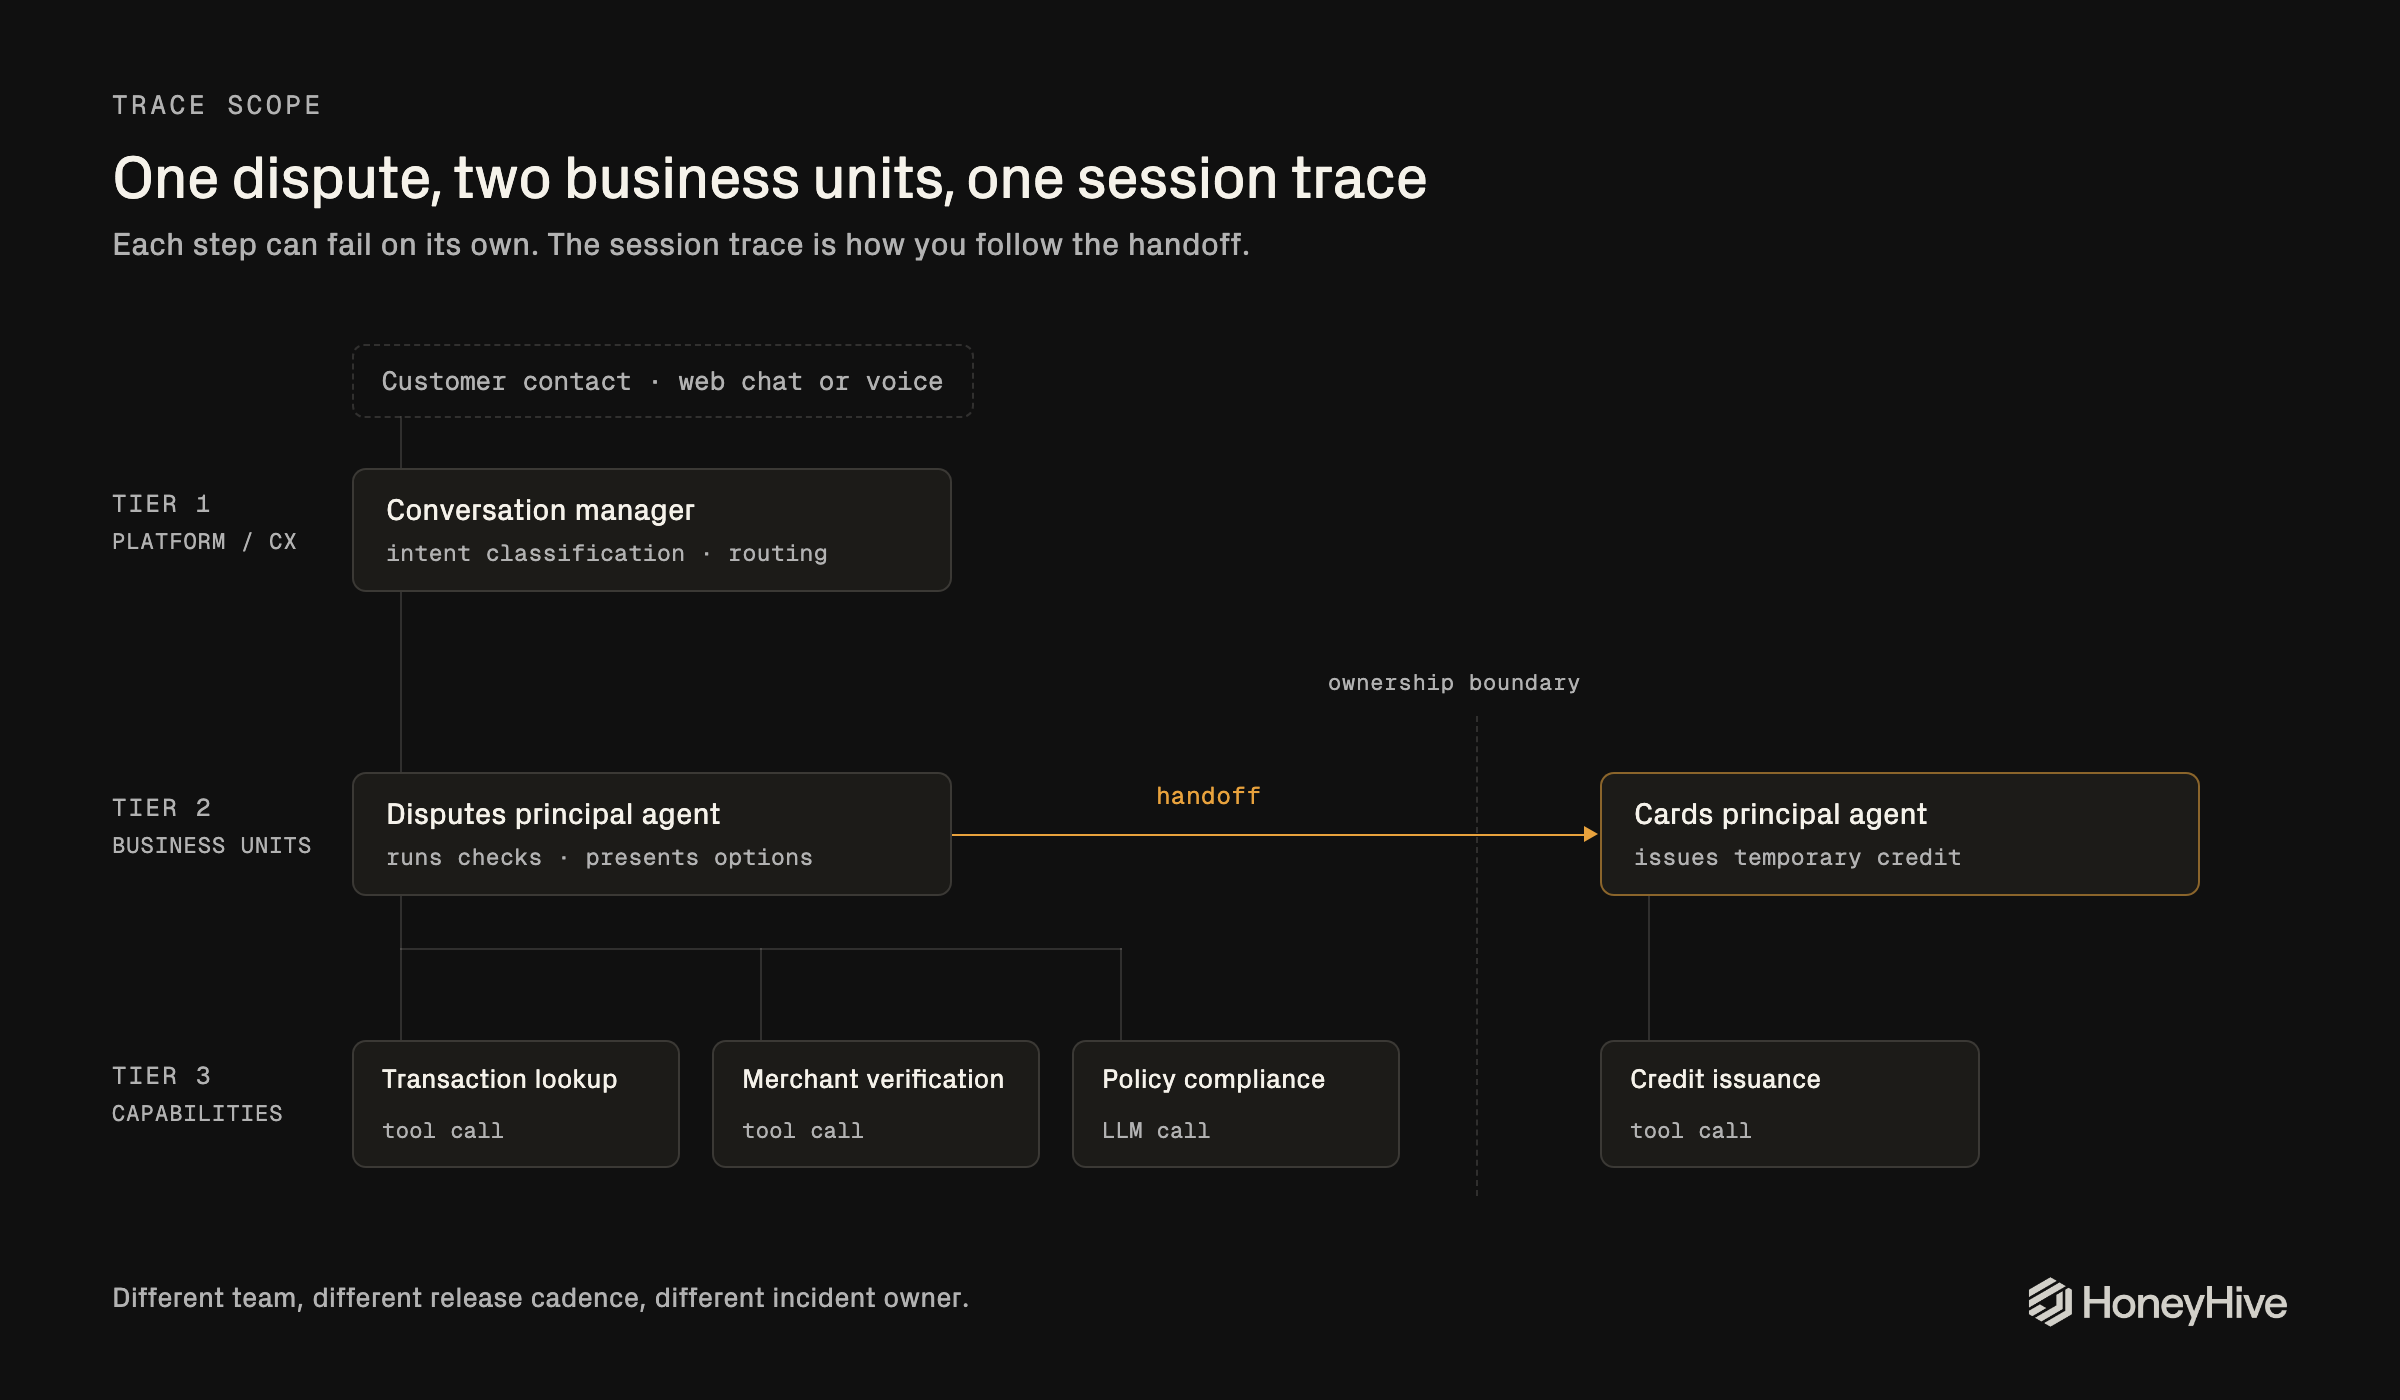
The path crosses two principal agents owned by different business units, several specialized agents, and multiple tool calls, and it can run for minutes. With a shared session_id, the whole interaction is one queryable record: what it cost, how it scored, what an auditor would need. With W3C propagation on the disputes-to-cards handoff, the cards work also nests under the disputes span that triggered it. Without propagation, the cards events still land in the session but as siblings, and an investigator reconstructs the call chain by hand.
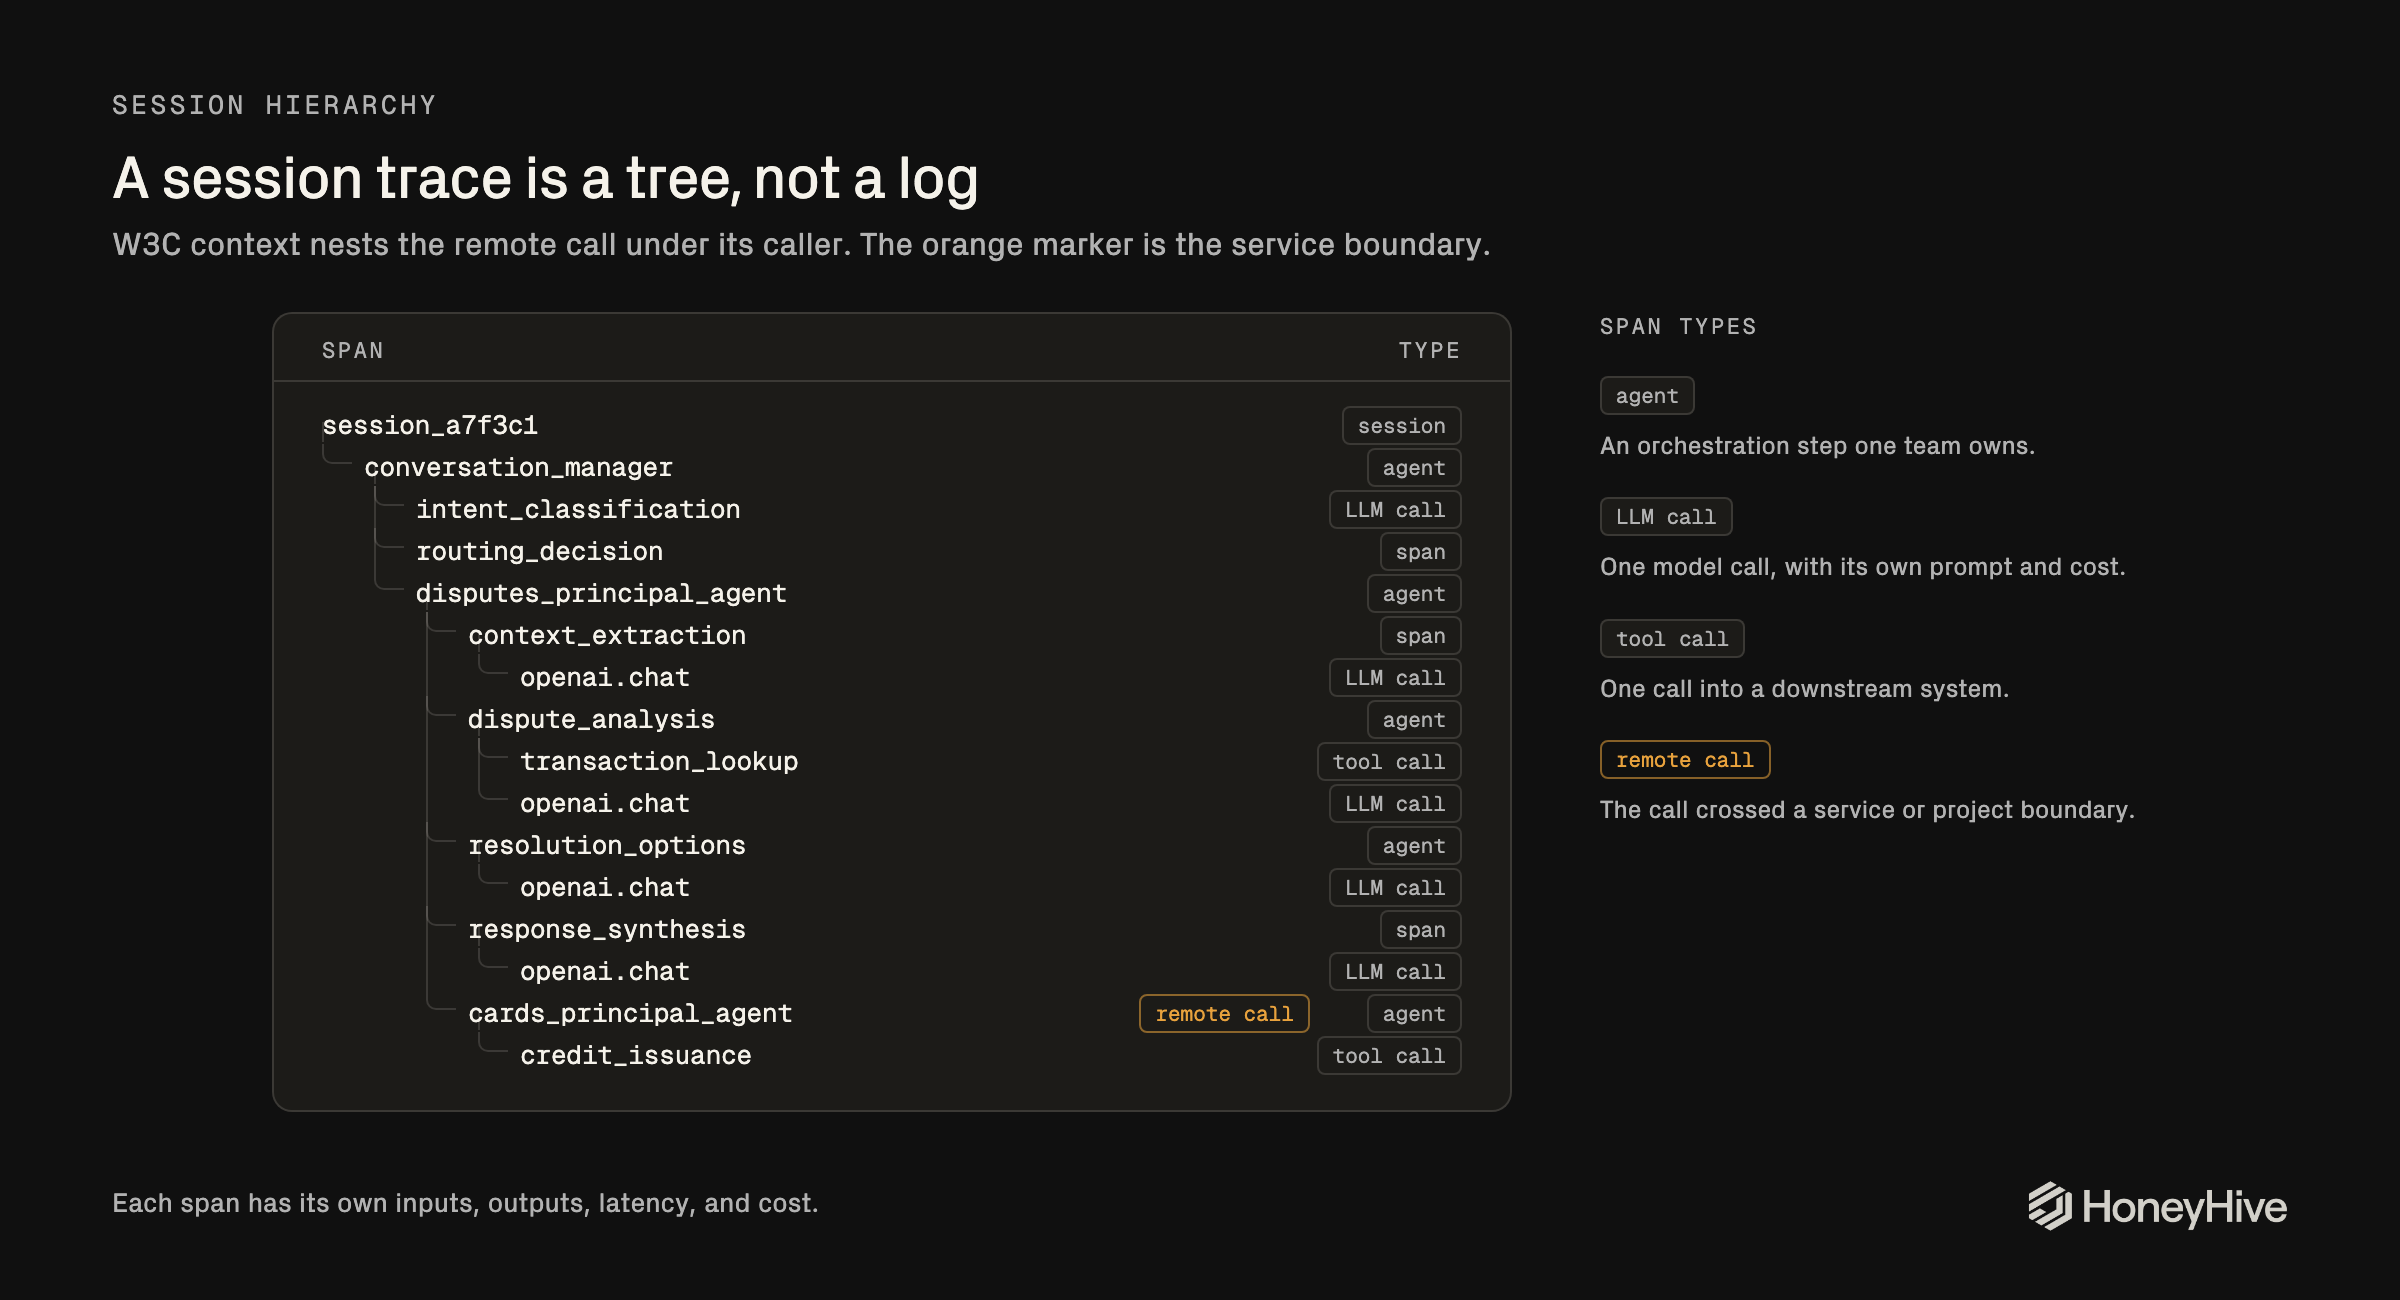
The tree now shows structure but not yet shared meaning: each stack still labels models, token counts, and tool calls in its own dialect. That is the normalization problem.
Normalize the telemetry, not the application stack
Three open conventions dominate GenAI instrumentation: OpenTelemetry’s GenAI semantic conventions, OpenInference, and OpenLLMetry. They name the same concepts differently, and the OpenTelemetry GenAI conventions are still in Development status, so even the emerging standard is a moving target. Framework-specific attributes and custom events sit on top of all three.
The volatility is measurable: in our study of 73,000 production agent schemas across three customers, the median meaningful field lived between 15 and 68 days depending on the workload. Dashboards, alerts, and evaluators bind to field paths, so every rename, refactor, or framework switch breaks something downstream unless those bindings sit on a stable interface.
Asking every agent team to emit identical attributes would recreate the framework-mandate problem one layer down. The alternative is to let teams keep their instrumentation and normalize at ingestion. HoneyHive stores every event in a fixed canonical schema: root fields such as session_id, event_id, parent_id, event_type, and event_name never move, and structured buckets (inputs, outputs, config, metadata, metrics, feedback, user_properties) hold the payload detail that evaluators and investigators query.
At ingestion, HoneyHive maps each convention’s attributes into those canonical keys:
- Token counts arriving as
gen_ai.usage.input_tokensorllm.token_count.promptland in the same canonical token fields. - Model identity from
gen_ai.request.modelorllm.model_namemaps toconfig.model. - Span-kind signals from
openinference.span.kind,traceloop.span.kind, or OTel GenAI agent attributes normalize into one span-kind field.
The payoff is that shared assets stop breaking. Cost rollups, org-wide dashboards, audit exports, and evaluators query canonical fields, so when a business unit upgrades an instrumentation package or moves frameworks, the mappings absorb the renames within the conventions HoneyHive covers. Normalizing conventions is unglamorous, high-maintenance work, which is why a platform should own it rather than assign it to every application team.
Evaluation turns normalized traces into governance
Governance needs a judgment layer on top of the record, one that scores whether an interaction was good rather than only recording that it happened. Normalized traces are what make that layer buildable once instead of per-team.
HoneyHive evaluators run offline in CI and online against production traffic, scoped to whole sessions, individual steps, model calls, tools, or chains. That scoping turns fleet questions into queries: the accuracy of the model calls inside the disputes agent, sessions where context extraction ran longer than two seconds, or the validation failure rate of one specific tool. Organization templates propagate baseline evaluators and charts to new projects, so “groundedness for customer-facing agents” is measured the same way in every business unit while domain teams add their own evaluators on top.
That shared quality language lets approval become proportional to risk. Low-risk changes, like a prompt tweak on an internal agent, can clear automated gates backed by evaluation evidence. High-risk changes and exceptions keep explicit human approval, with accountable owners signing off where regulation or brand risk requires it.
Once the record is normalized and scored, it carries the governance functions that otherwise each need their own program:
- Audit trails. A complete record of what agents did and said, and on what context.
- Quality gates. Automated evaluation standing between a change and production.
- Cost control. Attribution and budgets by team, agent, and business unit.
- Compliance monitoring. Detection of policy violations and regulated content.
- Incident response. Rapid diagnosis when production behavior changes.
In operation, scores are a triage instrument. A session-level score flags which interactions need review; span-level scores show an investigator which branch to open first.
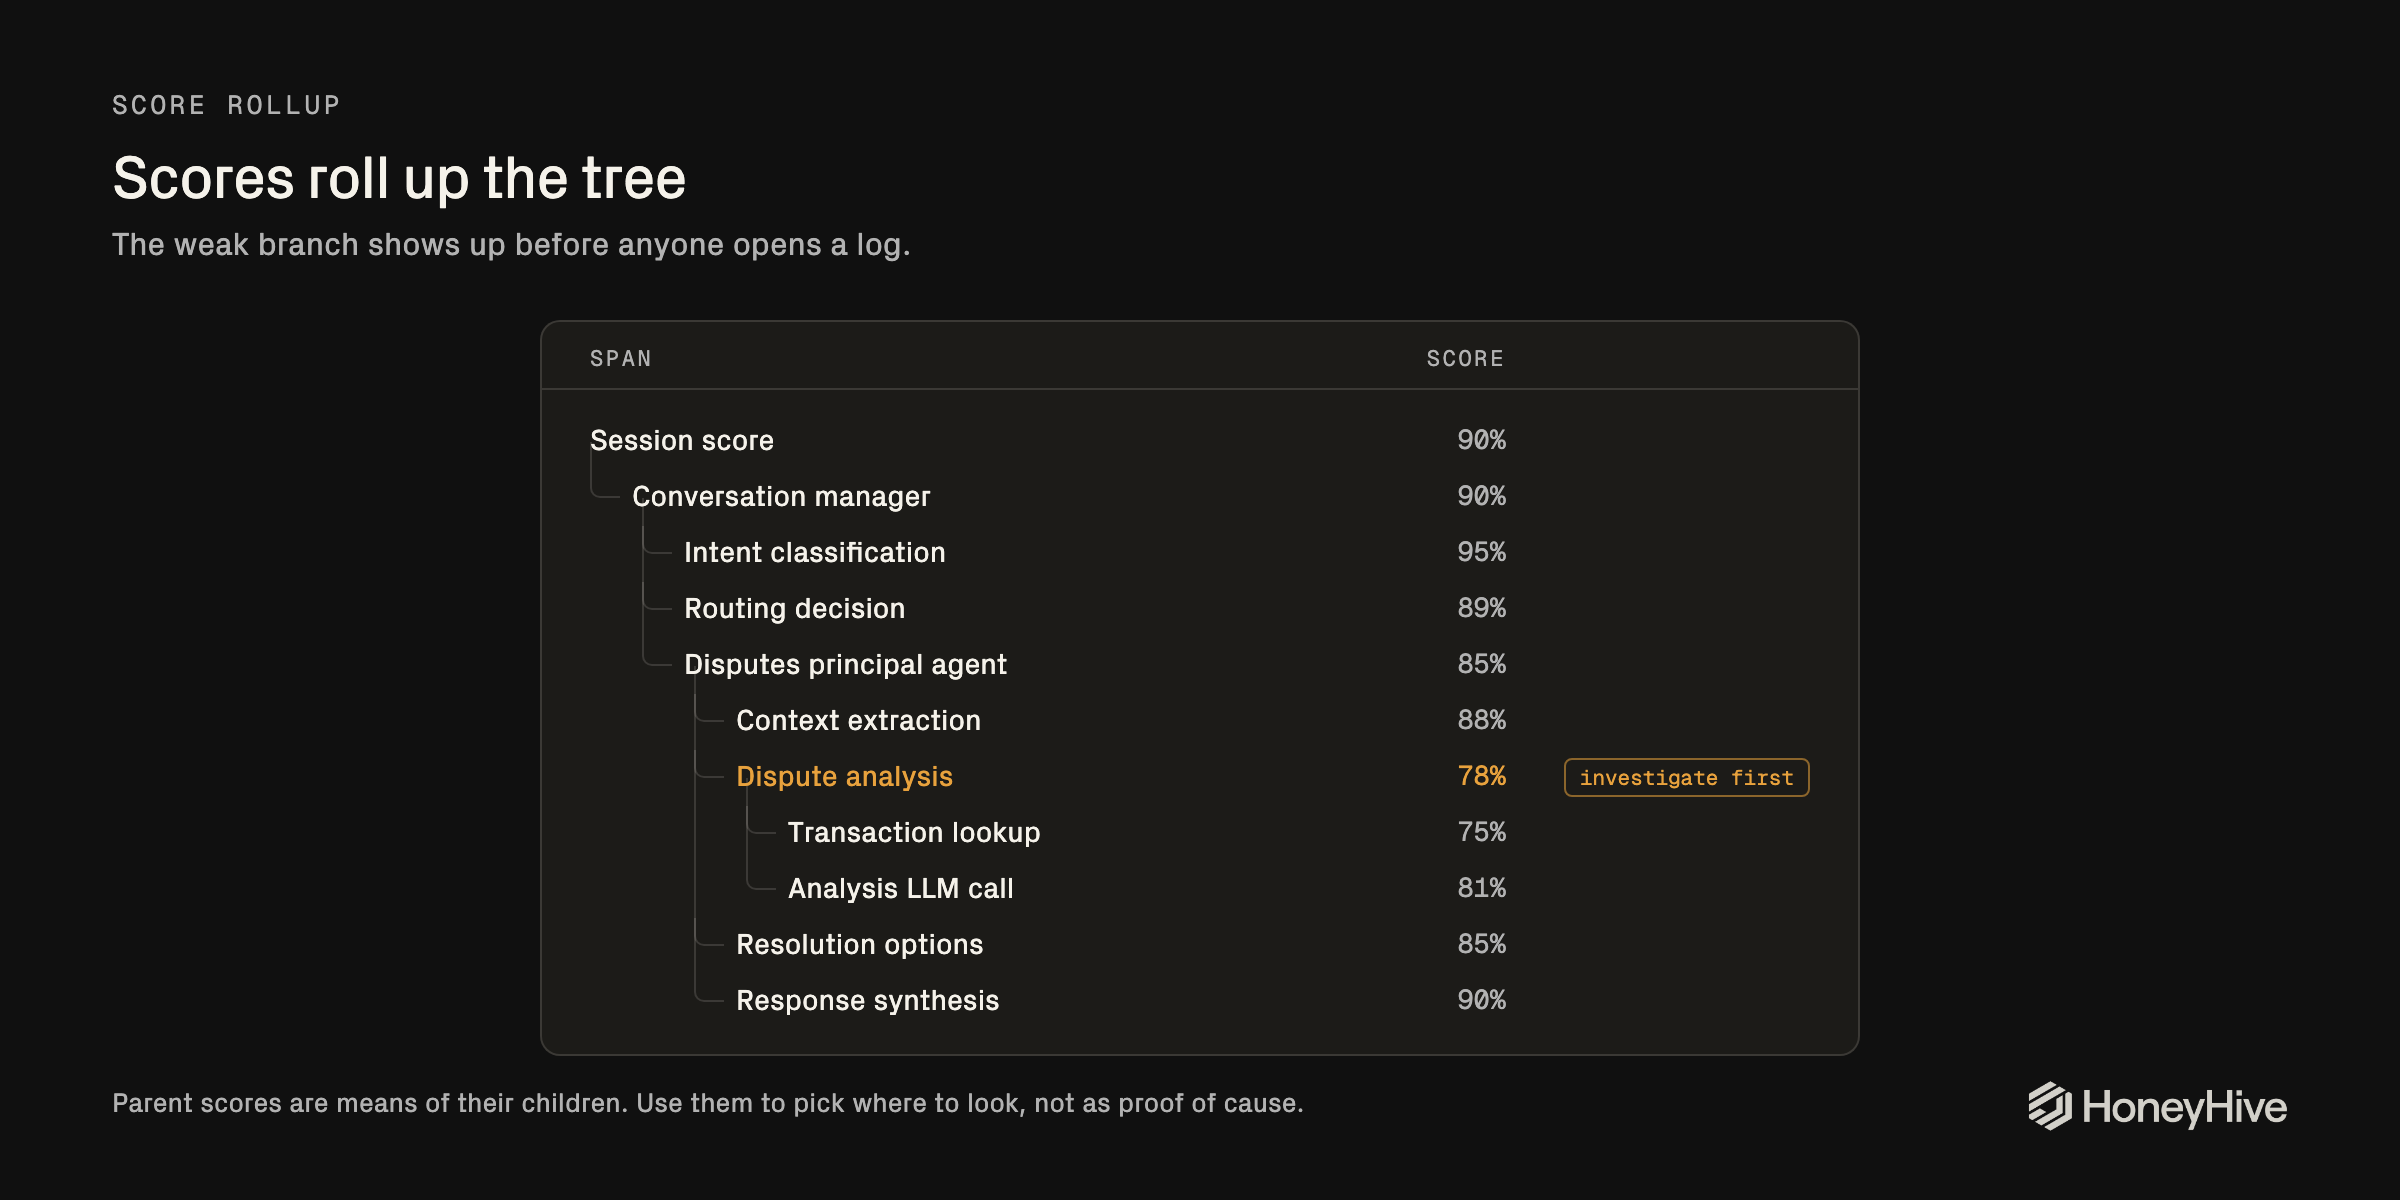
Treat them that way. A low score on the dispute-analysis branch says start there, with that branch’s trace content, dependencies, and surrounding events. Confirming the root cause still takes the trace payloads, the code path, and dependency health, not the score alone.
Match the adoption path to team maturity
None of this arrives in one rollout, and sequencing is where platform strategies most often go wrong: catalogs get populated before any traffic exists, or evaluation programs launch before there are traces to score. The dependency order is fixed. Evaluators need normalized traces, normalization needs instrumented traffic, and instrumentation needs enforced identifiers.
- Stable IDs, ownership, and data boundaries. Enforce session IDs and project tags, define thin registry schemas for owner and risk tier, and classify pilot data. Decide the hosting model and where telemetry data will live before any restricted data is ingested.
- Instrumented pilot. Trace one high-value path end to end, such as the conversation manager plus one principal agent. Populate registry entries from real telemetry rather than filling a catalog speculatively.
- Normalized traces and organization evaluations. Send pilot traffic through canonical mapping, turn on org templates, and add span-level evaluators for high-risk steps with thresholds per risk tier.
- Automated quality gates and regression workflows. Wire CI/CD gates, regression tests on golden sessions, and incident workflows fed by evaluation signals.
- Expanded coverage and W3C propagation. Roll out to more principal agents and add cross-service trace propagation where runtimes allow.
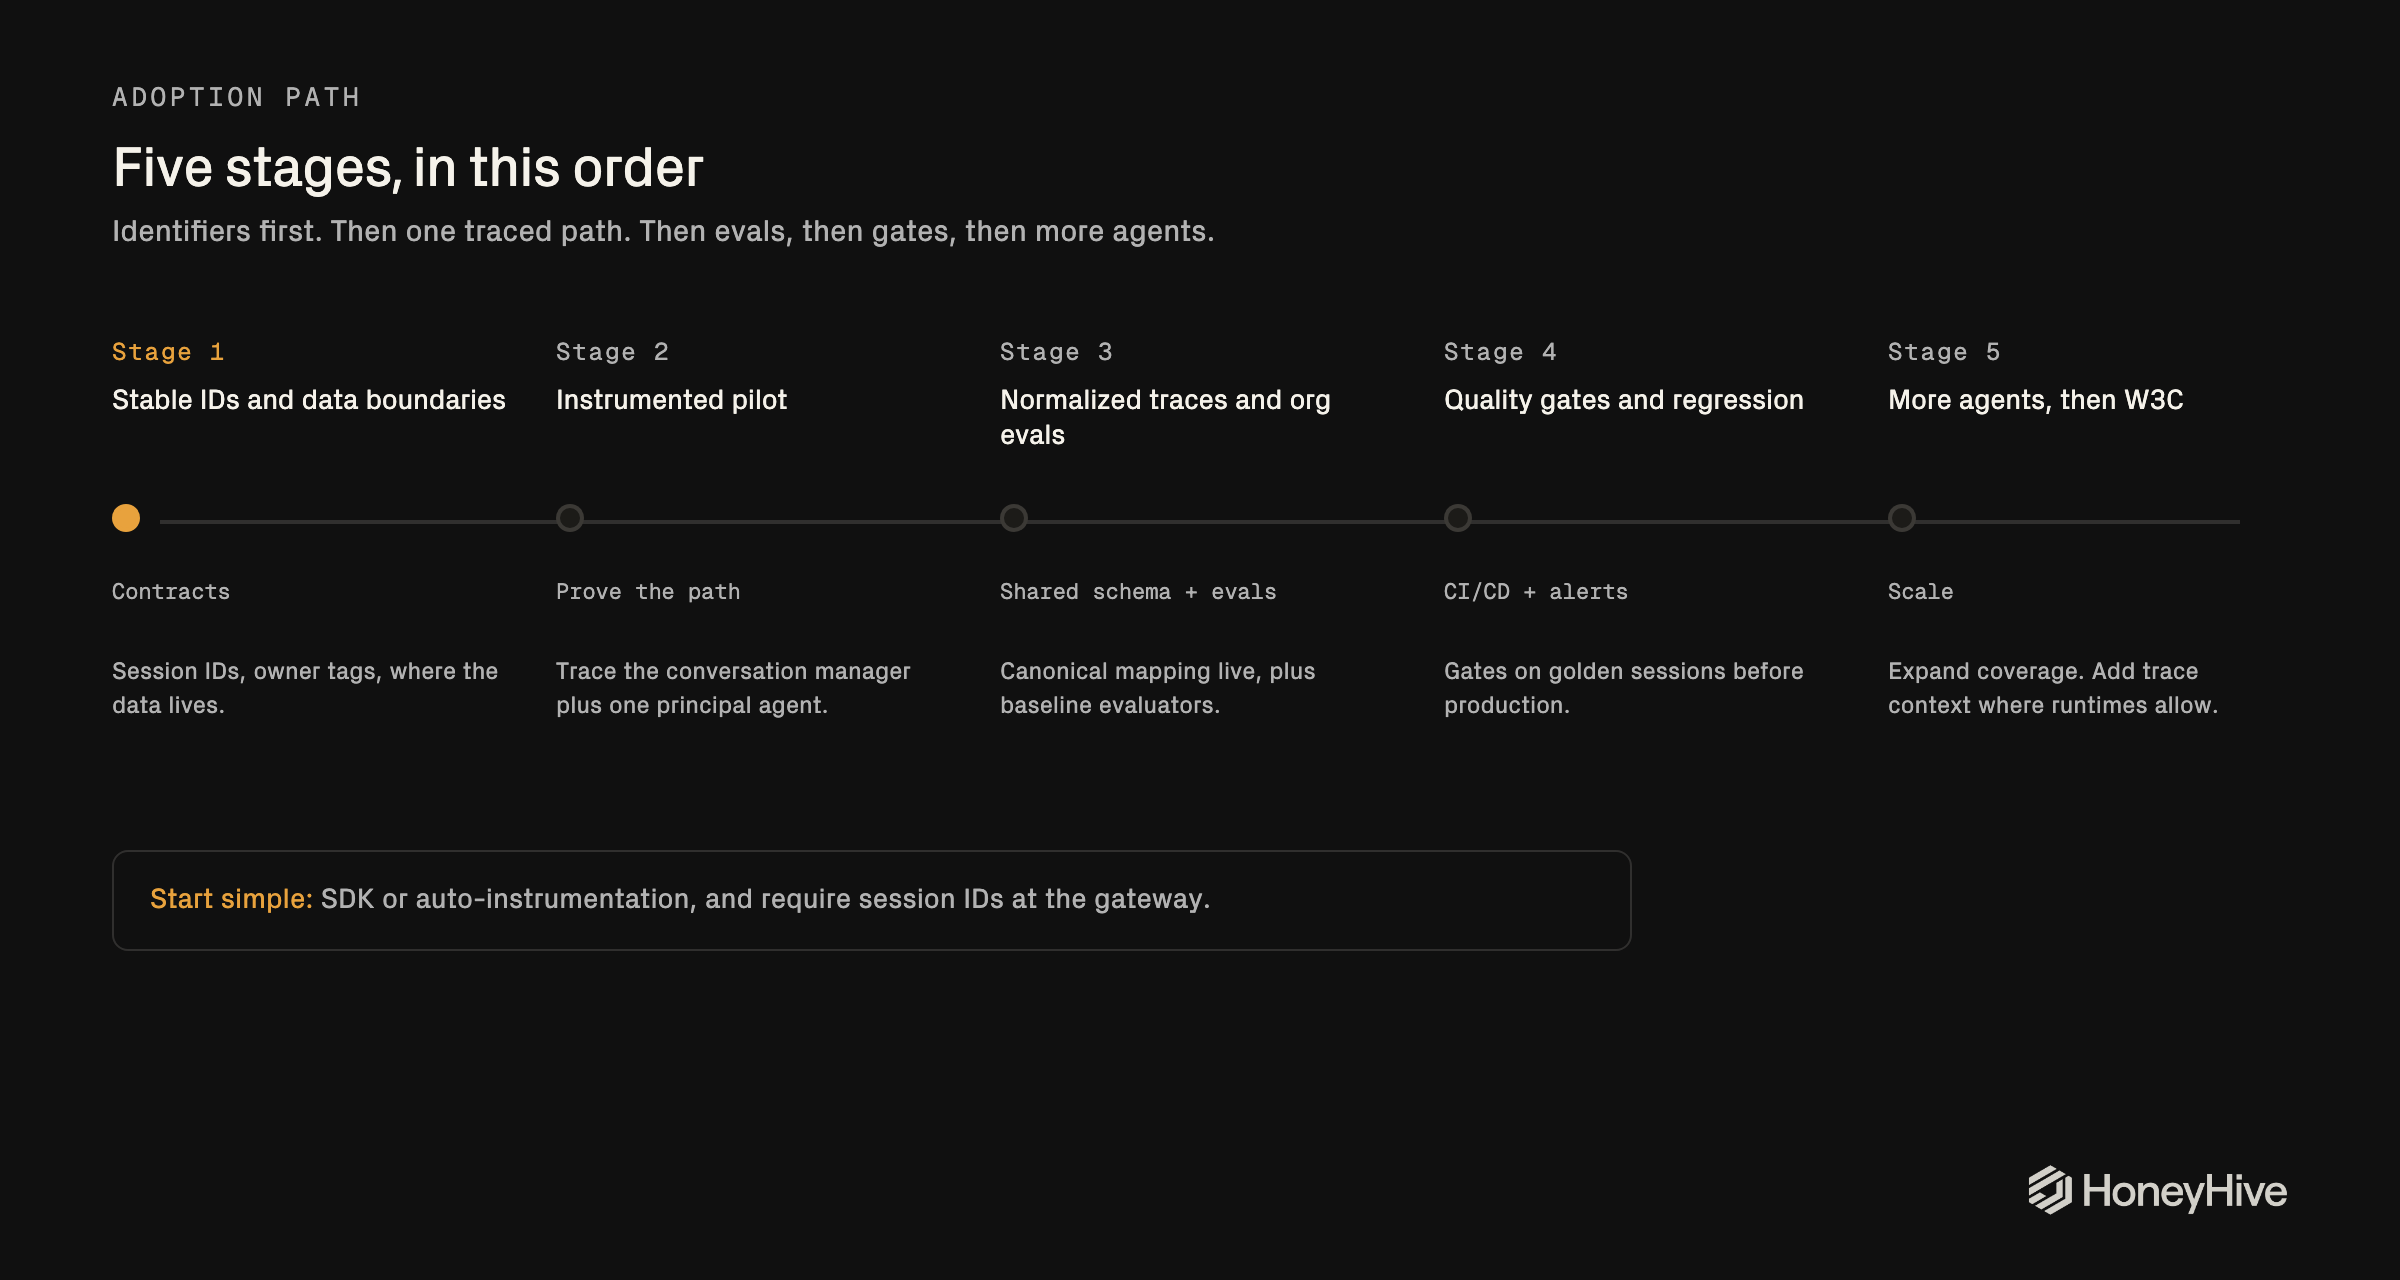
Along the way, the platform should absorb complexity rather than redistribute it. Teams on the paved path get SDK or supported auto-instrumentation, session IDs enforced at gateways or builder export hooks, starter evaluators, and a deliberately narrow first scope. Teams that need more take on more: custom metadata, domain evaluators, cross-service propagation, local deployment controls. Both paths satisfy the same contracts, so the platform’s guarantees hold either way. And because the standards cross business-unit lines, the program needs an executive sponsor with the authority to require them.
One control plane, many data planes
The last constraint is where the data itself may live. Classification and residency rules in regulated enterprises often require that raw prompts, outputs, and tool results stay inside an approved boundary: a region, a business unit’s environment, or the enterprise’s own cloud. Early observability tooling assumed all telemetry could land in one central store, which left regulated teams choosing between visibility and compliance.
The architecture that resolves this splits the planes. In HoneyHive’s platform architecture, the control plane handles authentication, RBAC, organization settings, evaluator definitions, and fleet metadata. Data planes handle ingestion, storage, and evaluation compute inside the customer or business-unit environment. Per the data-flow, raw payloads (LLM inputs and outputs, full trace content, evaluation input-output pairs) stay in the data plane, while telemetry metadata (durations, token counts, model names, session aggregates, numeric evaluation scores) crosses to the control plane for fleet dashboards and alerting.
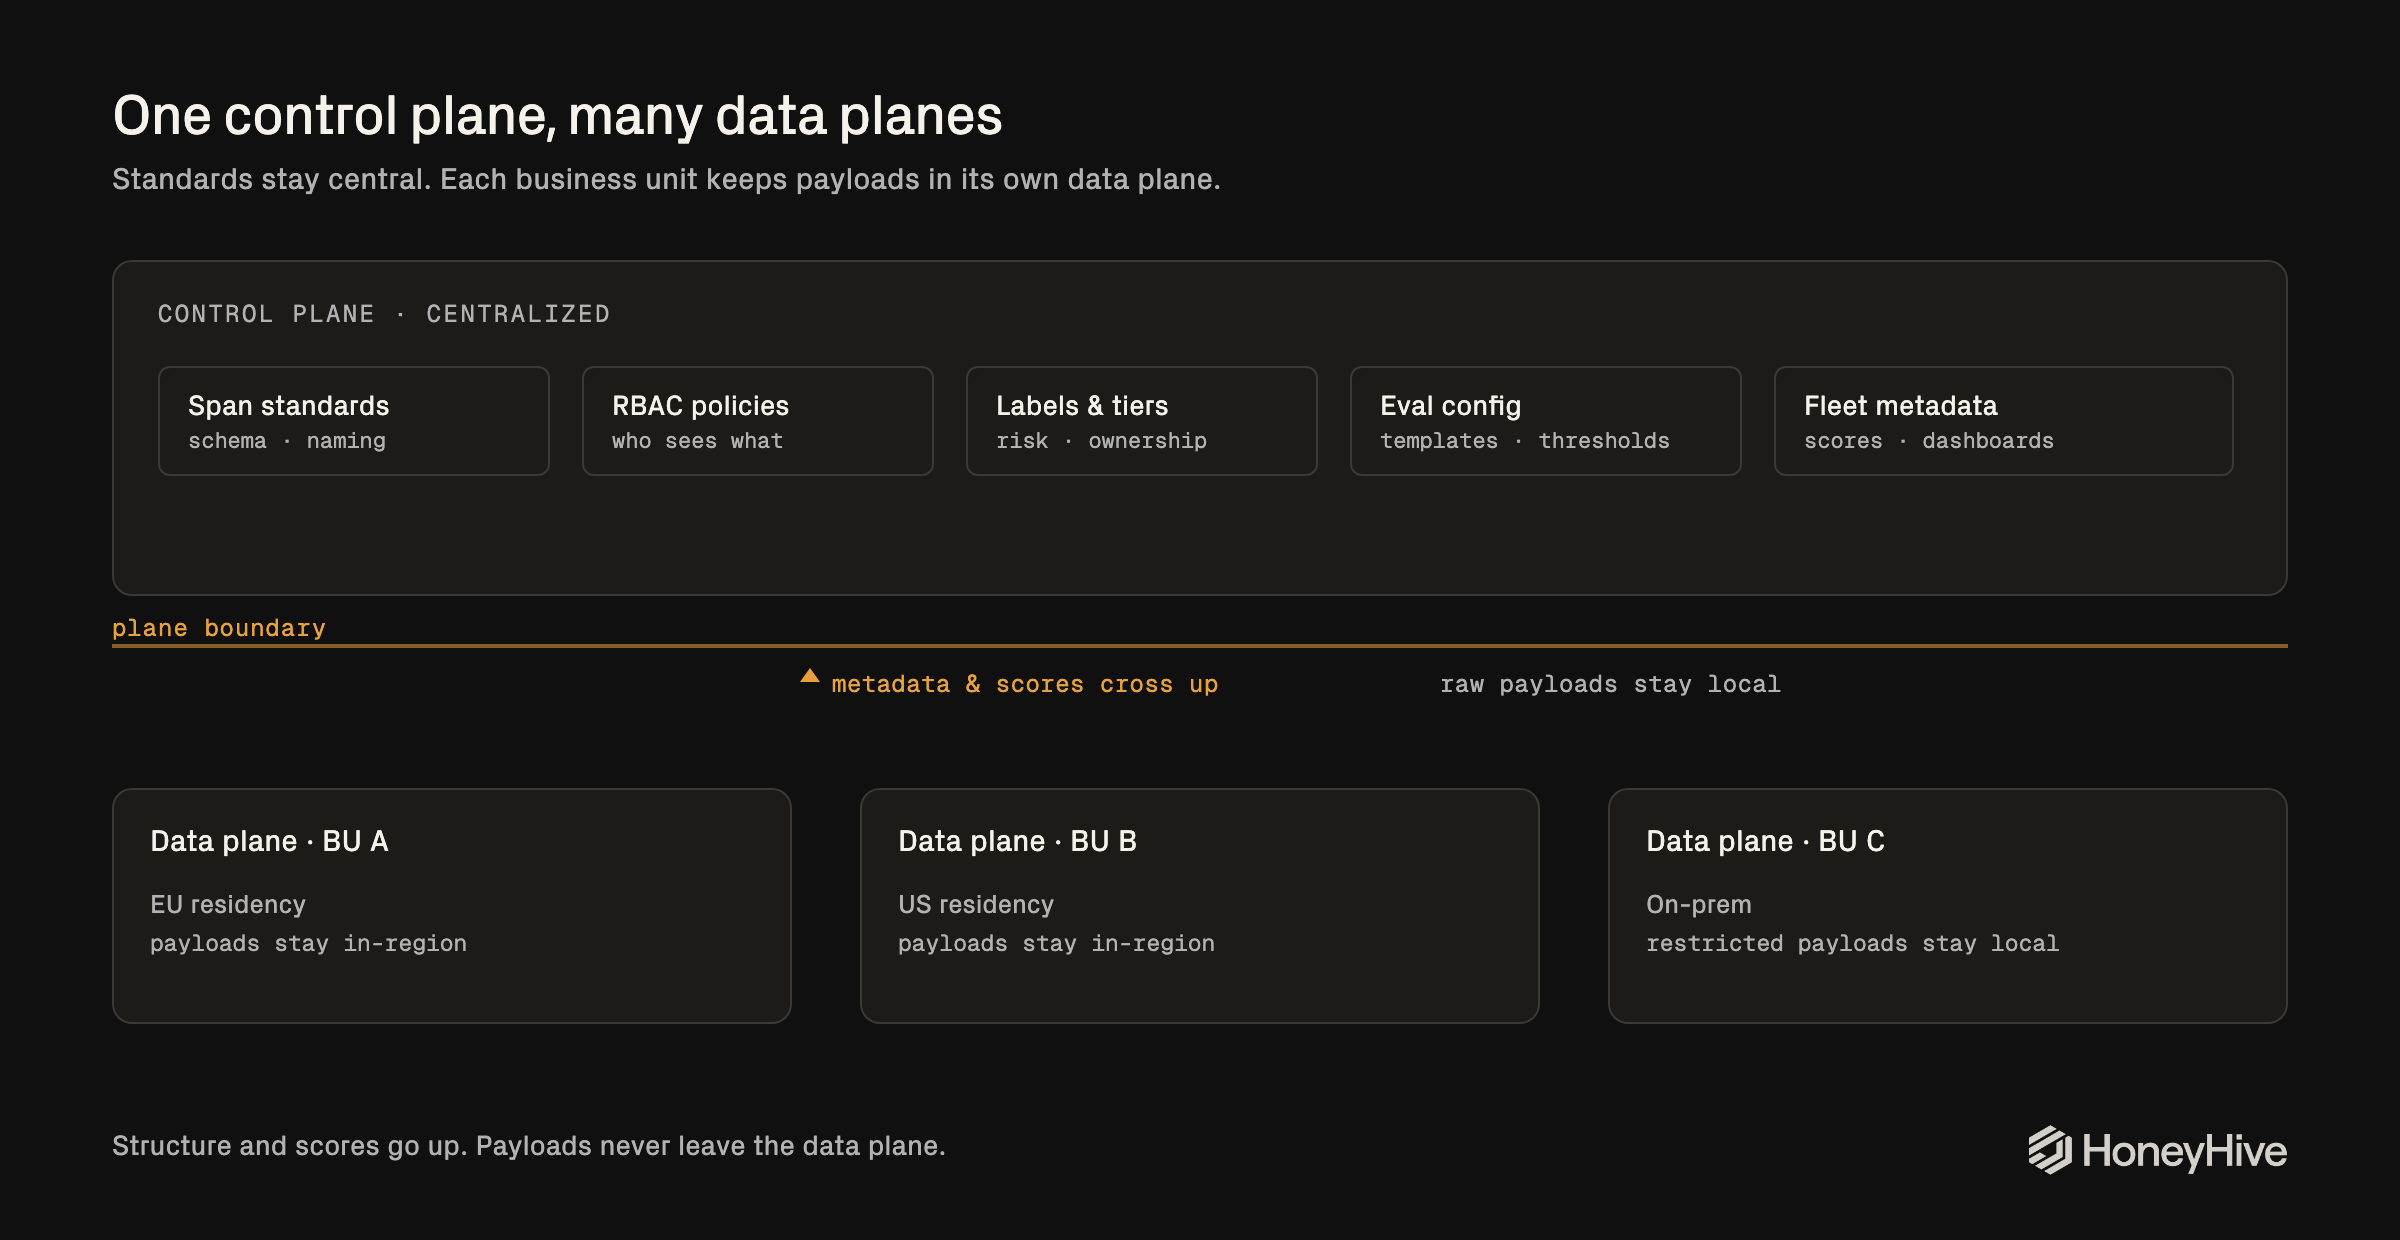
Each stakeholder gets the half they need. Security and compliance teams audit structure and quality signals centrally, and review actual content inside the owning boundary with authorization. Platform teams evolve one control plane instead of one per business unit. Business units keep sensitive payloads under their own classification, retention, and residency rules without opting out of fleet-wide standards.
Where HoneyHive fits
We built HoneyHive to standardize this chaos. It is the observability and evaluation layer of the enterprise AI control plane: we do the work of normalizing the telemetry each stack emits into one canonical event model, preserving session and trace hierarchy, so evaluation, investigation, and governance run on a single operational record.
A pilot does not need the whole fleet. Pick one conversation flow and one principal agent, install HoneyHive’s honeyhive-instrument skill from the AI coding agents docs, and hand your coding agent a prompt like:
Use honeyhive-instrument to instrument our disputes principal agent with HoneyHive. Enforce a shared session_id across services. Add W3C trace context on the handoff if runtimes support it.
For the architecture underneath, see platform architecture and data flow and residency. To map this onto your own agent fleet, book a demo.